From Midterm to Milestones - The Evolution of SustainHub in GSoC 2025
Final Evaluation: From Agents to Collaboration — The Complete Journey of SustainHub
Hello everyone!
As GSoC 2025 draws to a close, I am both excited and reflective while writing this final evaluation blog for my project, SustainHub, carried out under the guidance of the Orthogonal Research and Education Lab (OREL).
When the journey began 12 weeks ago, SustainHub was little more than a vision:
- A simulator where contributors in an open-source ecosystem would be modeled as autonomous agents.
- A place where reinforcement learning could be applied to questions of sustainability, fairness, and resilience.
- A system that could provide insights into how to maintain long-term community health when contributors come and go, workloads shift, and motivations evolve.
Today, that vision has materialized into a framework that is not only working end-to-end but also producing measurable outcomes, visual insights, and even the beginnings of a research report.
This blog reflects on the complete journey: the technical milestones, the research depth, the challenges faced, and the new doors opened for the future.
What is SustainHub?
SustainHub is a simulation framework designed to study the dynamics of open-source sustainability through computational models.
At its core, SustainHub represents an open-source project as a collection of:
- Tasks → representing bug fixes, feature requests, or documentation work.
- Agents → representing contributors, each with their own skills, motivations, and behaviors.
- Environment → representing the evolving project landscape, with new tasks arriving, contributors joining or leaving, and stress events occurring.
But SustainHub is not just another toy simulator. Its differentiating strength is the integration of reinforcement learning into the heart of collaboration.
Instead of simply simulating random task assignment, SustainHub experiments with:
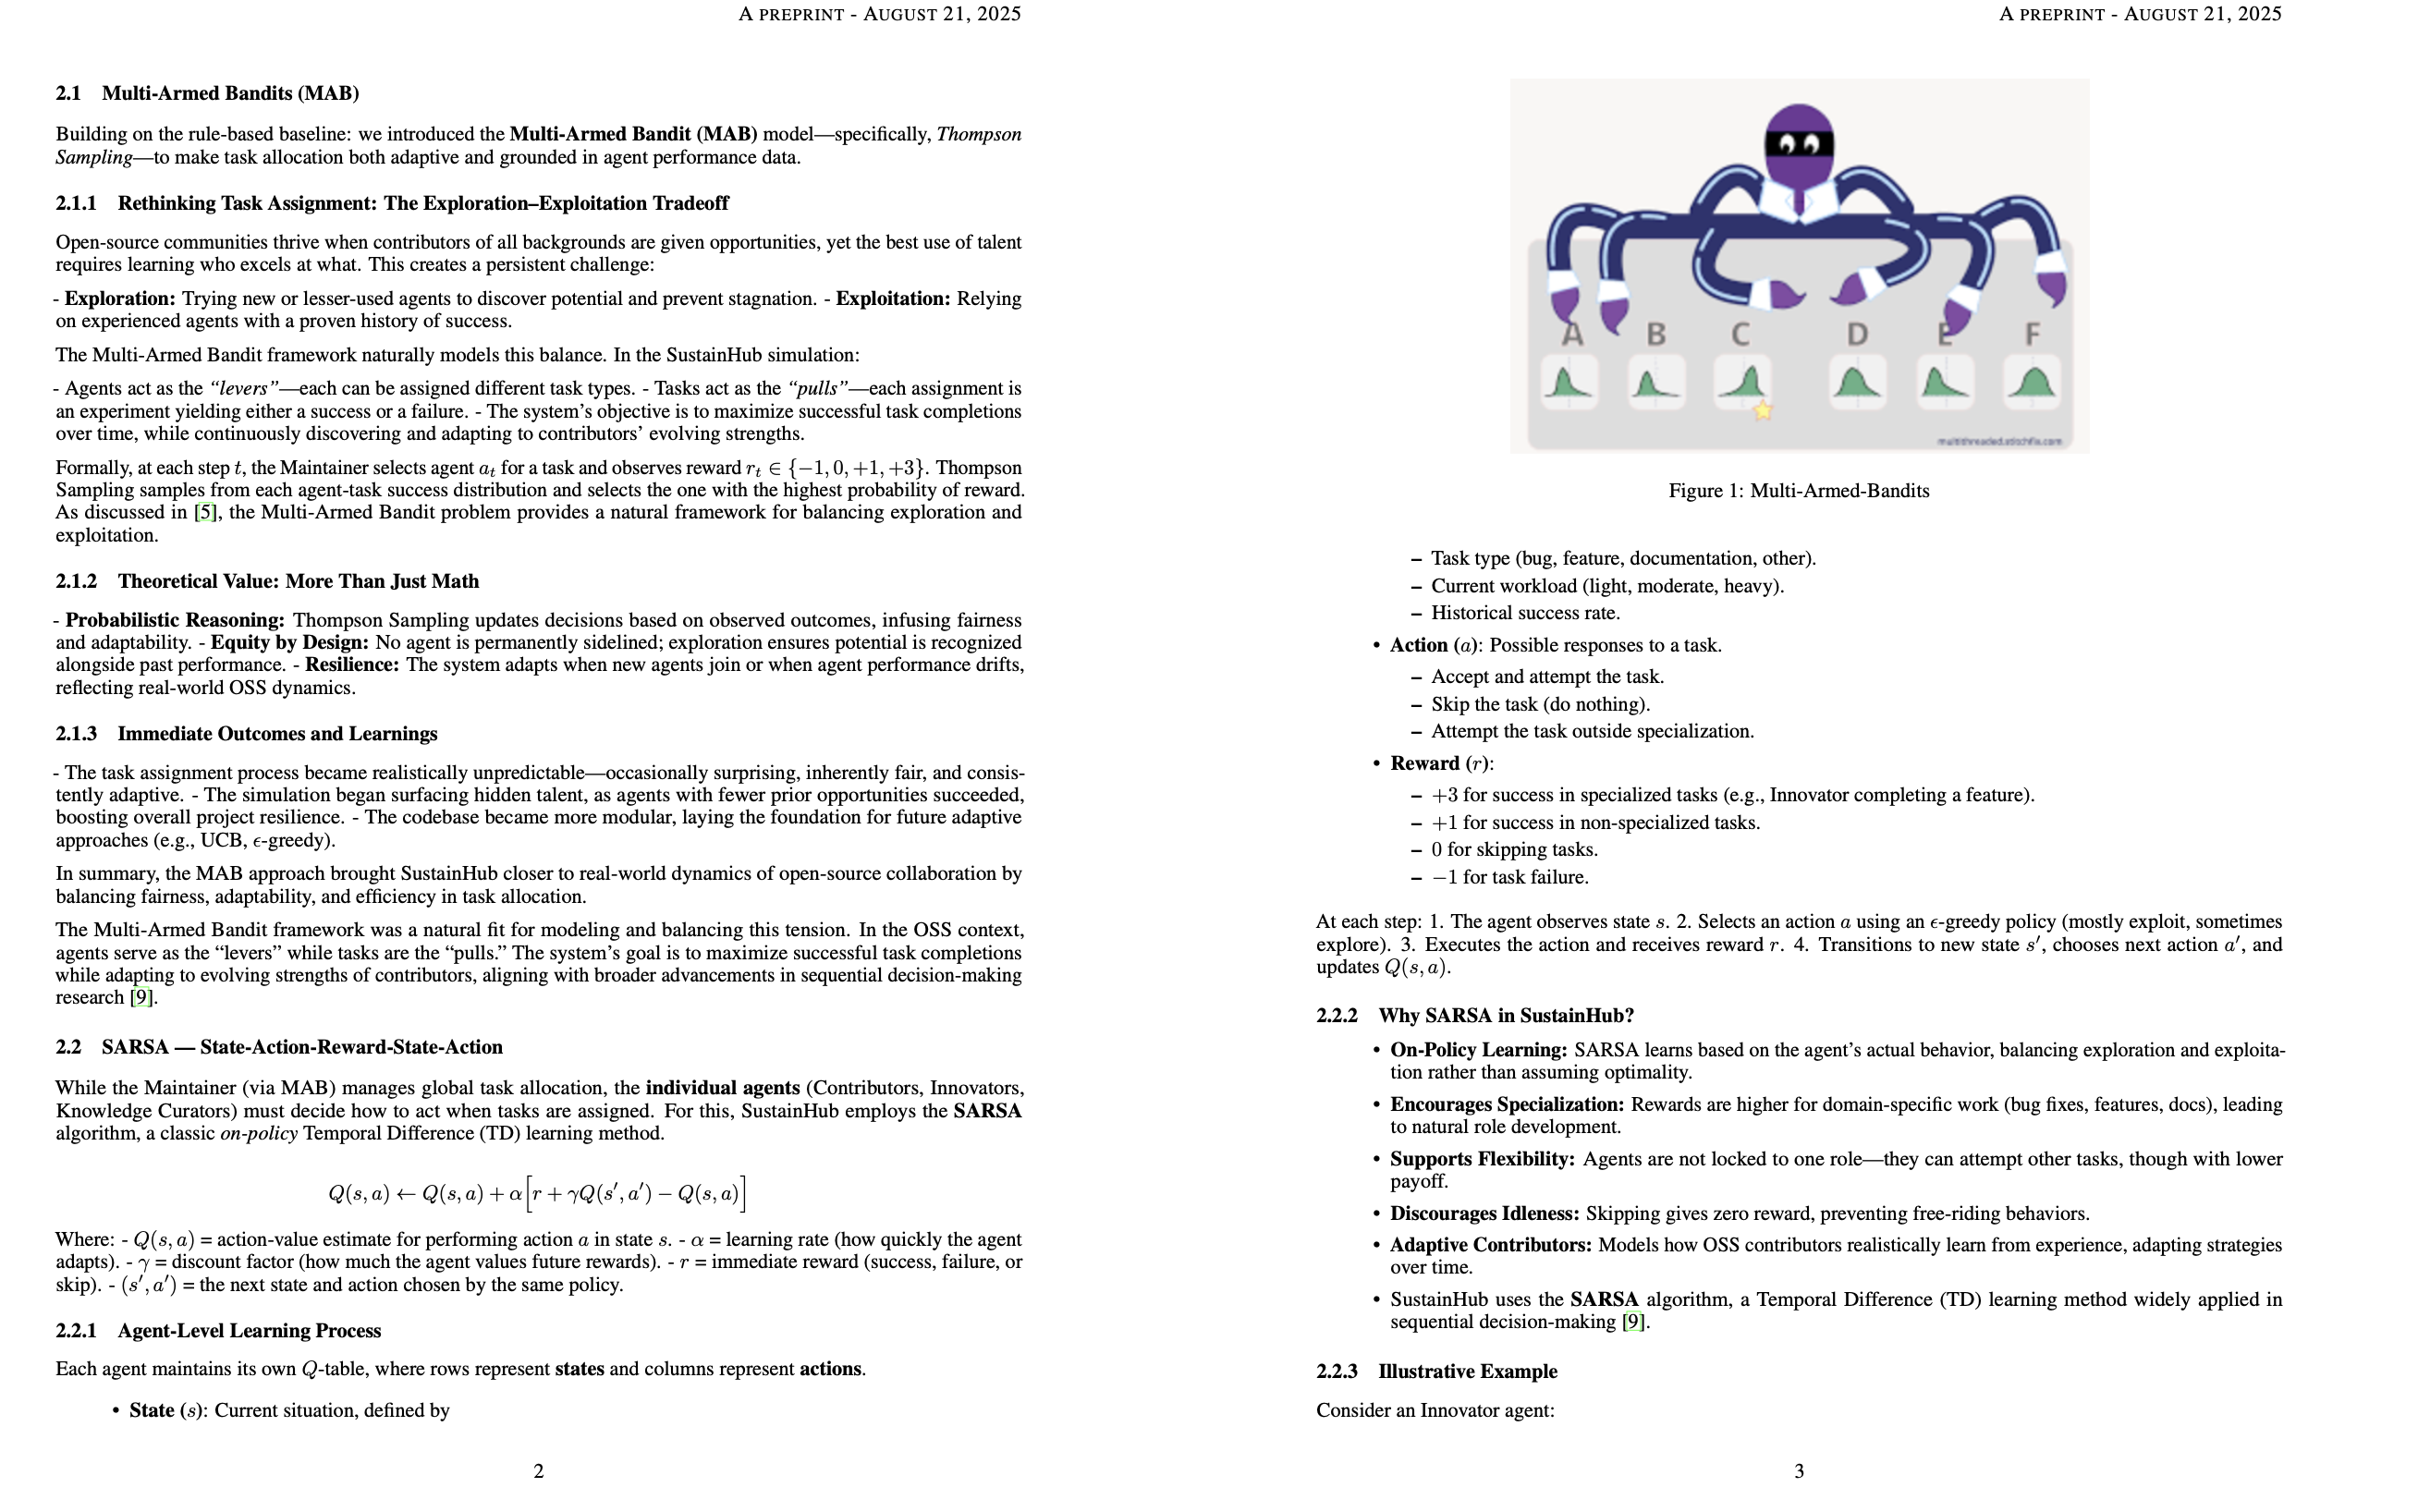
- Thompson Sampling (Multi-Armed Bandits) → for probabilistic, adaptive task allocation.
- SARSA (State–Action–Reward–State–Action) → for agents to learn from experience and improve over time.
- Reward Shaping → to represent motivation differences (some agents prefer bug-fixing, others are “feature builders,” others documentation contributors).
- Metrics for Sustainability → Harmony Index, Resilience Quotient, and Contribution Fairness.
- Interactive Visualization Dashboards → so results can be observed, not just logged.
In short: SustainHub is both a research tool and a playground, bridging agent-based modeling with reinforcement learning to explore what sustainability in open source means computationally.
Weekly Progress: Weeks 7–12
The second half of GSoC was where SustainHub transitioned from a solid prototype into a polished, research-ready system.
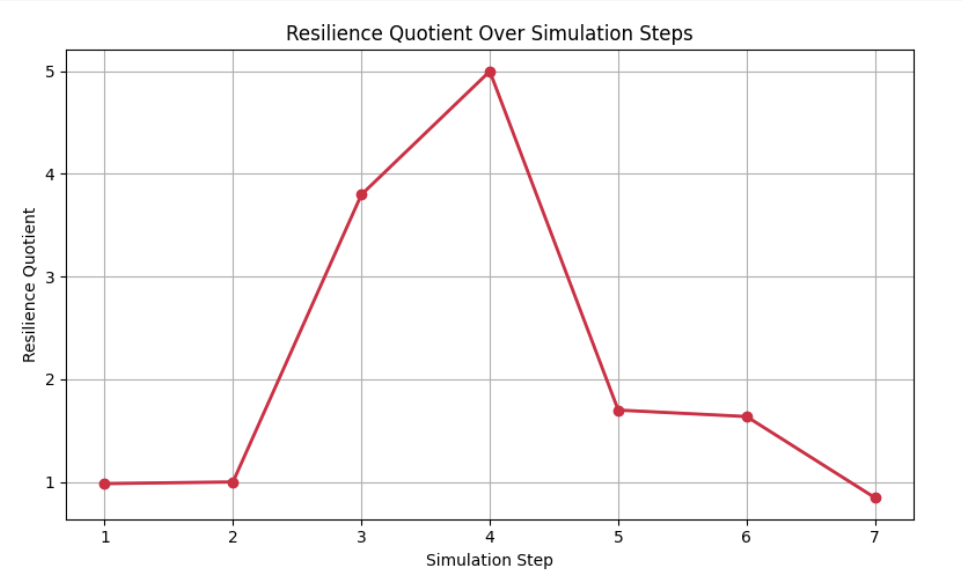
Week 7: Introducing the Resilience Quotient (RQ)
By mid-project, we had already established the Harmony Index (HI) as a measure of collaboration balance. But open source communities are not just about balance in stable times — they are constantly subject to shocks:
- A group of maintainers may suddenly leave.
- A large backlog of tasks may arrive after a release.
- Certain contributors may get overloaded.
To capture this, I designed the Resilience Quotient (RQ).
Formula (simplified):
[ RQ = \frac{Stability + Adaptability}{2} ]
- Stability → How much task completion rate drops when stress is applied.
- Adaptability → How quickly agents recover and redistribute workload.
Why this mattered:
- Open source projects rarely die due to lack of activity; they falter due to instability under stress.
- Modeling this gave SustainHub a way to quantify robustness, not just efficiency.
Key observations:
- With SARSA-enabled agents, RQ remained between 0.7–0.8, even when 20–25% of agents dropped out.
- Random (non-learning) agents, in contrast, saw RQ values below 0.5, showing much poorer recovery.
This was one of the most exciting moments: the system was proving that reinforcement learning adds resilience in simulations of collaboration.
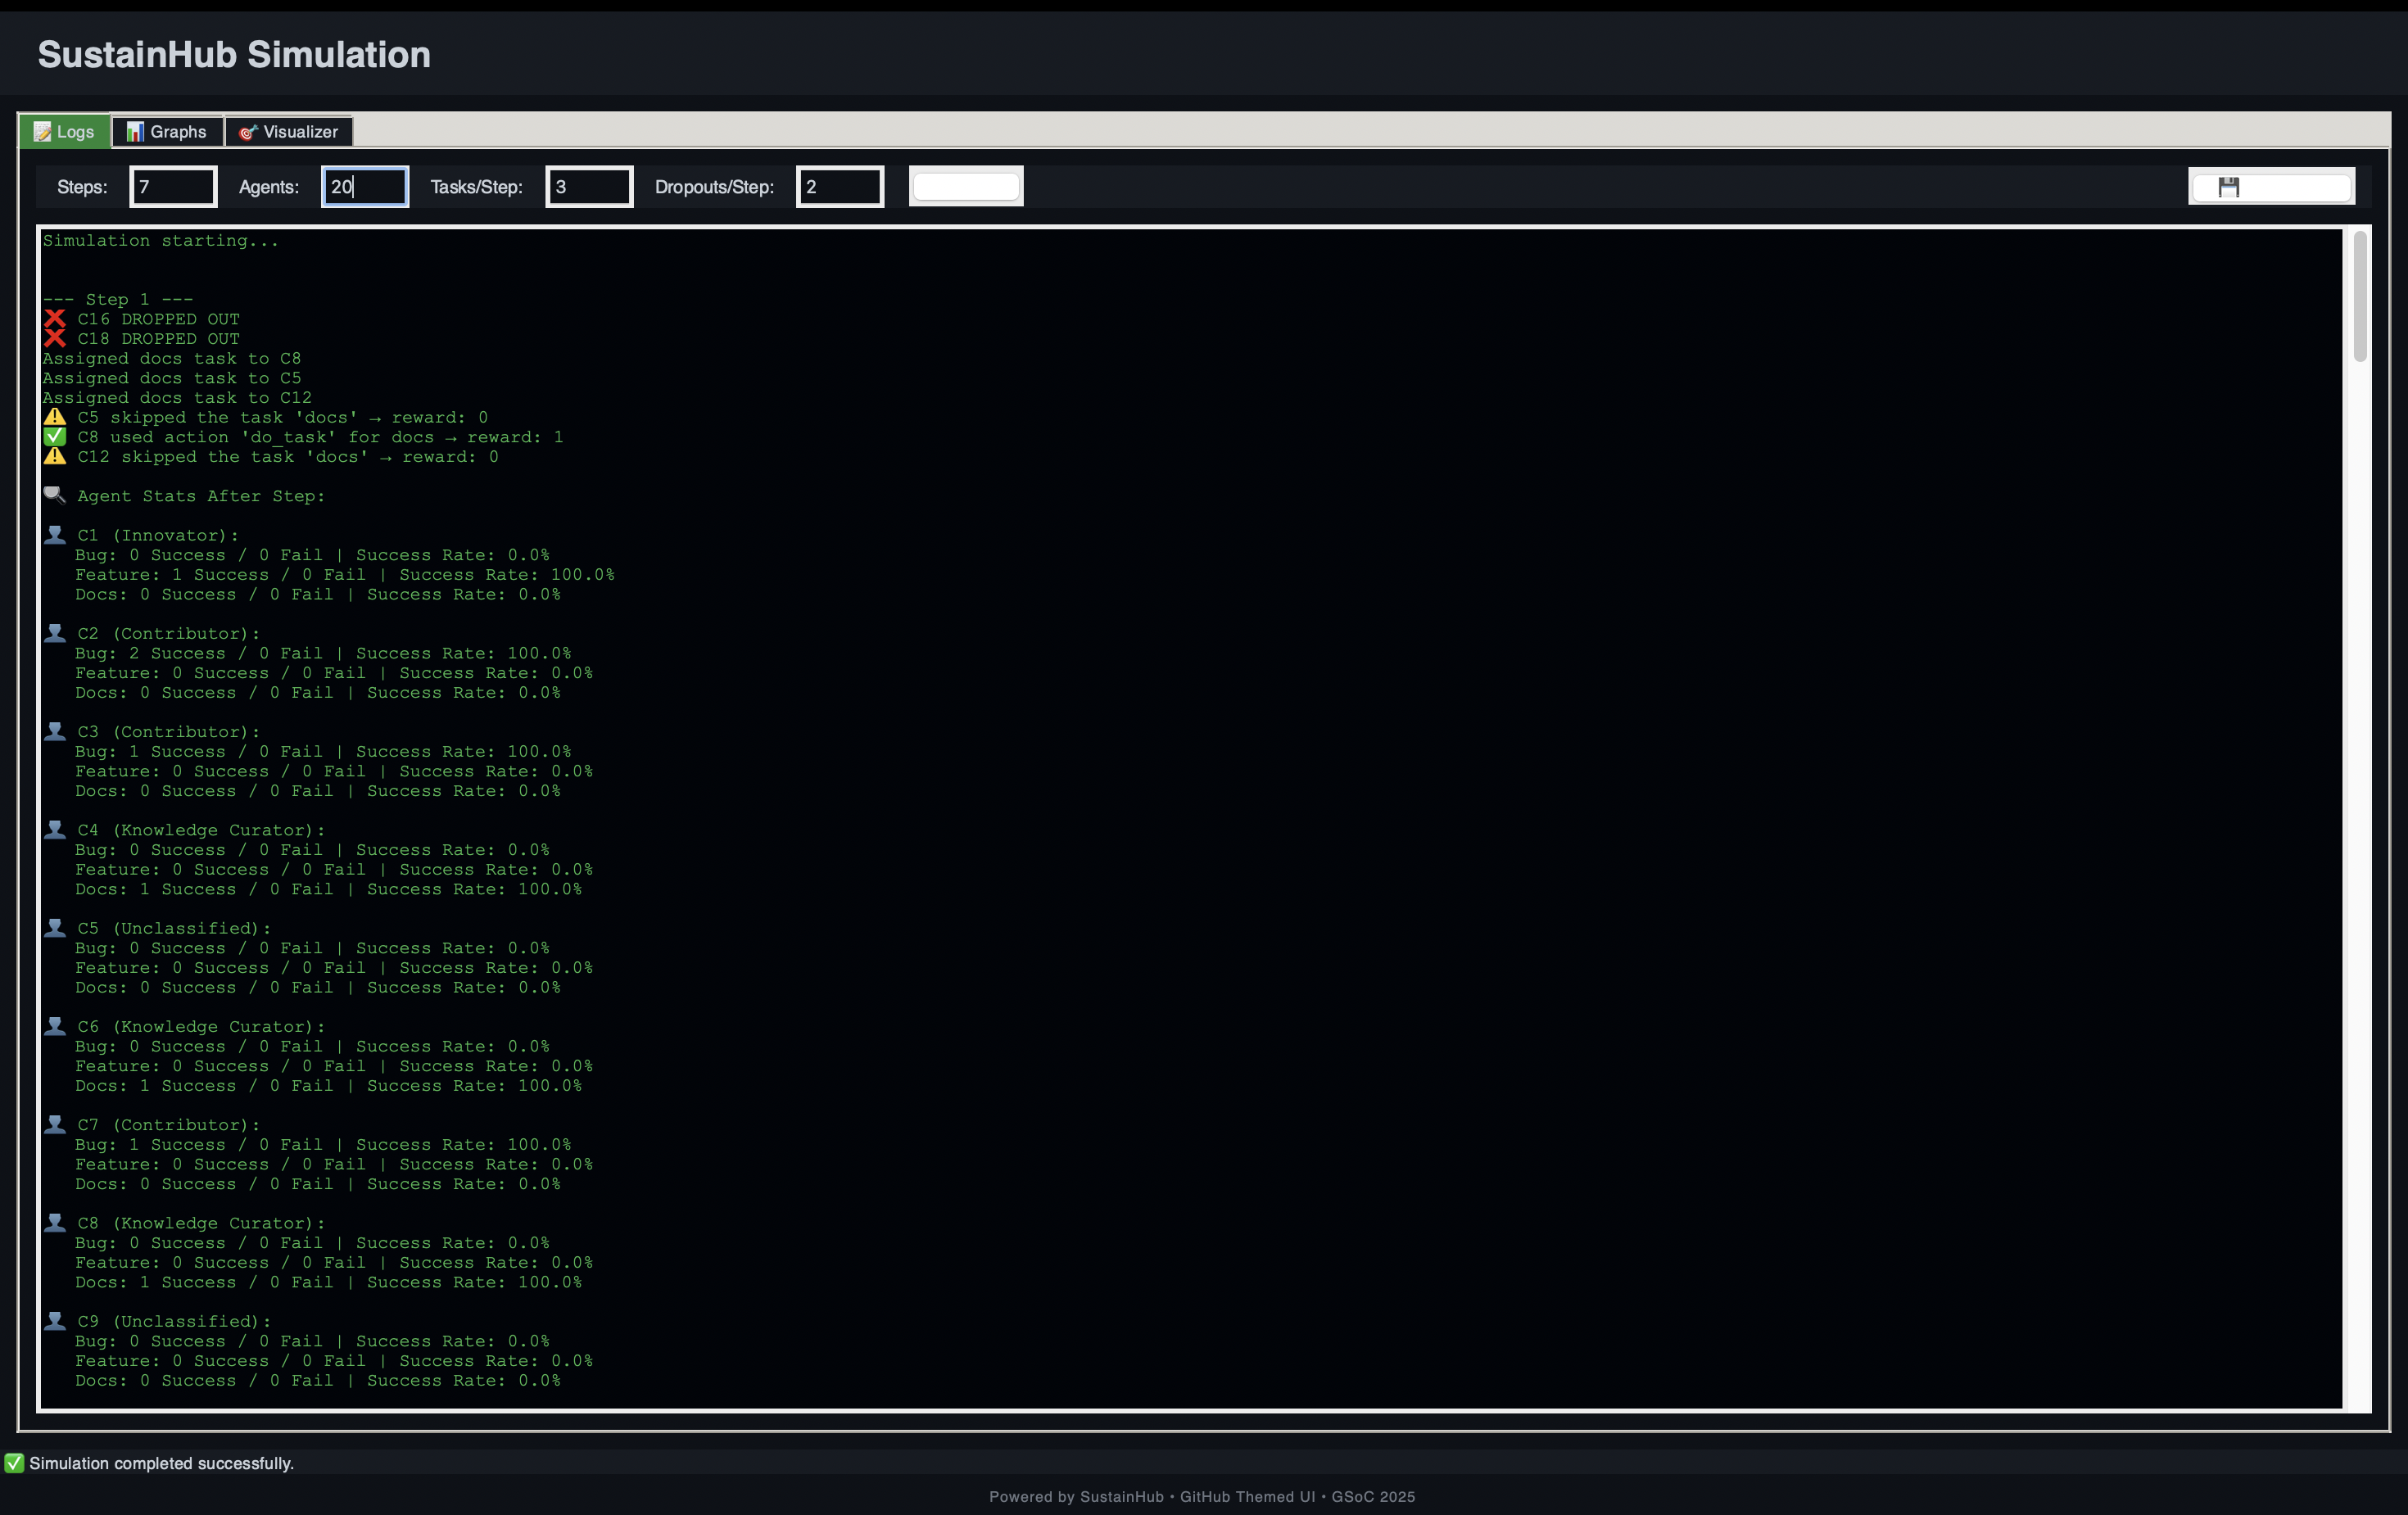
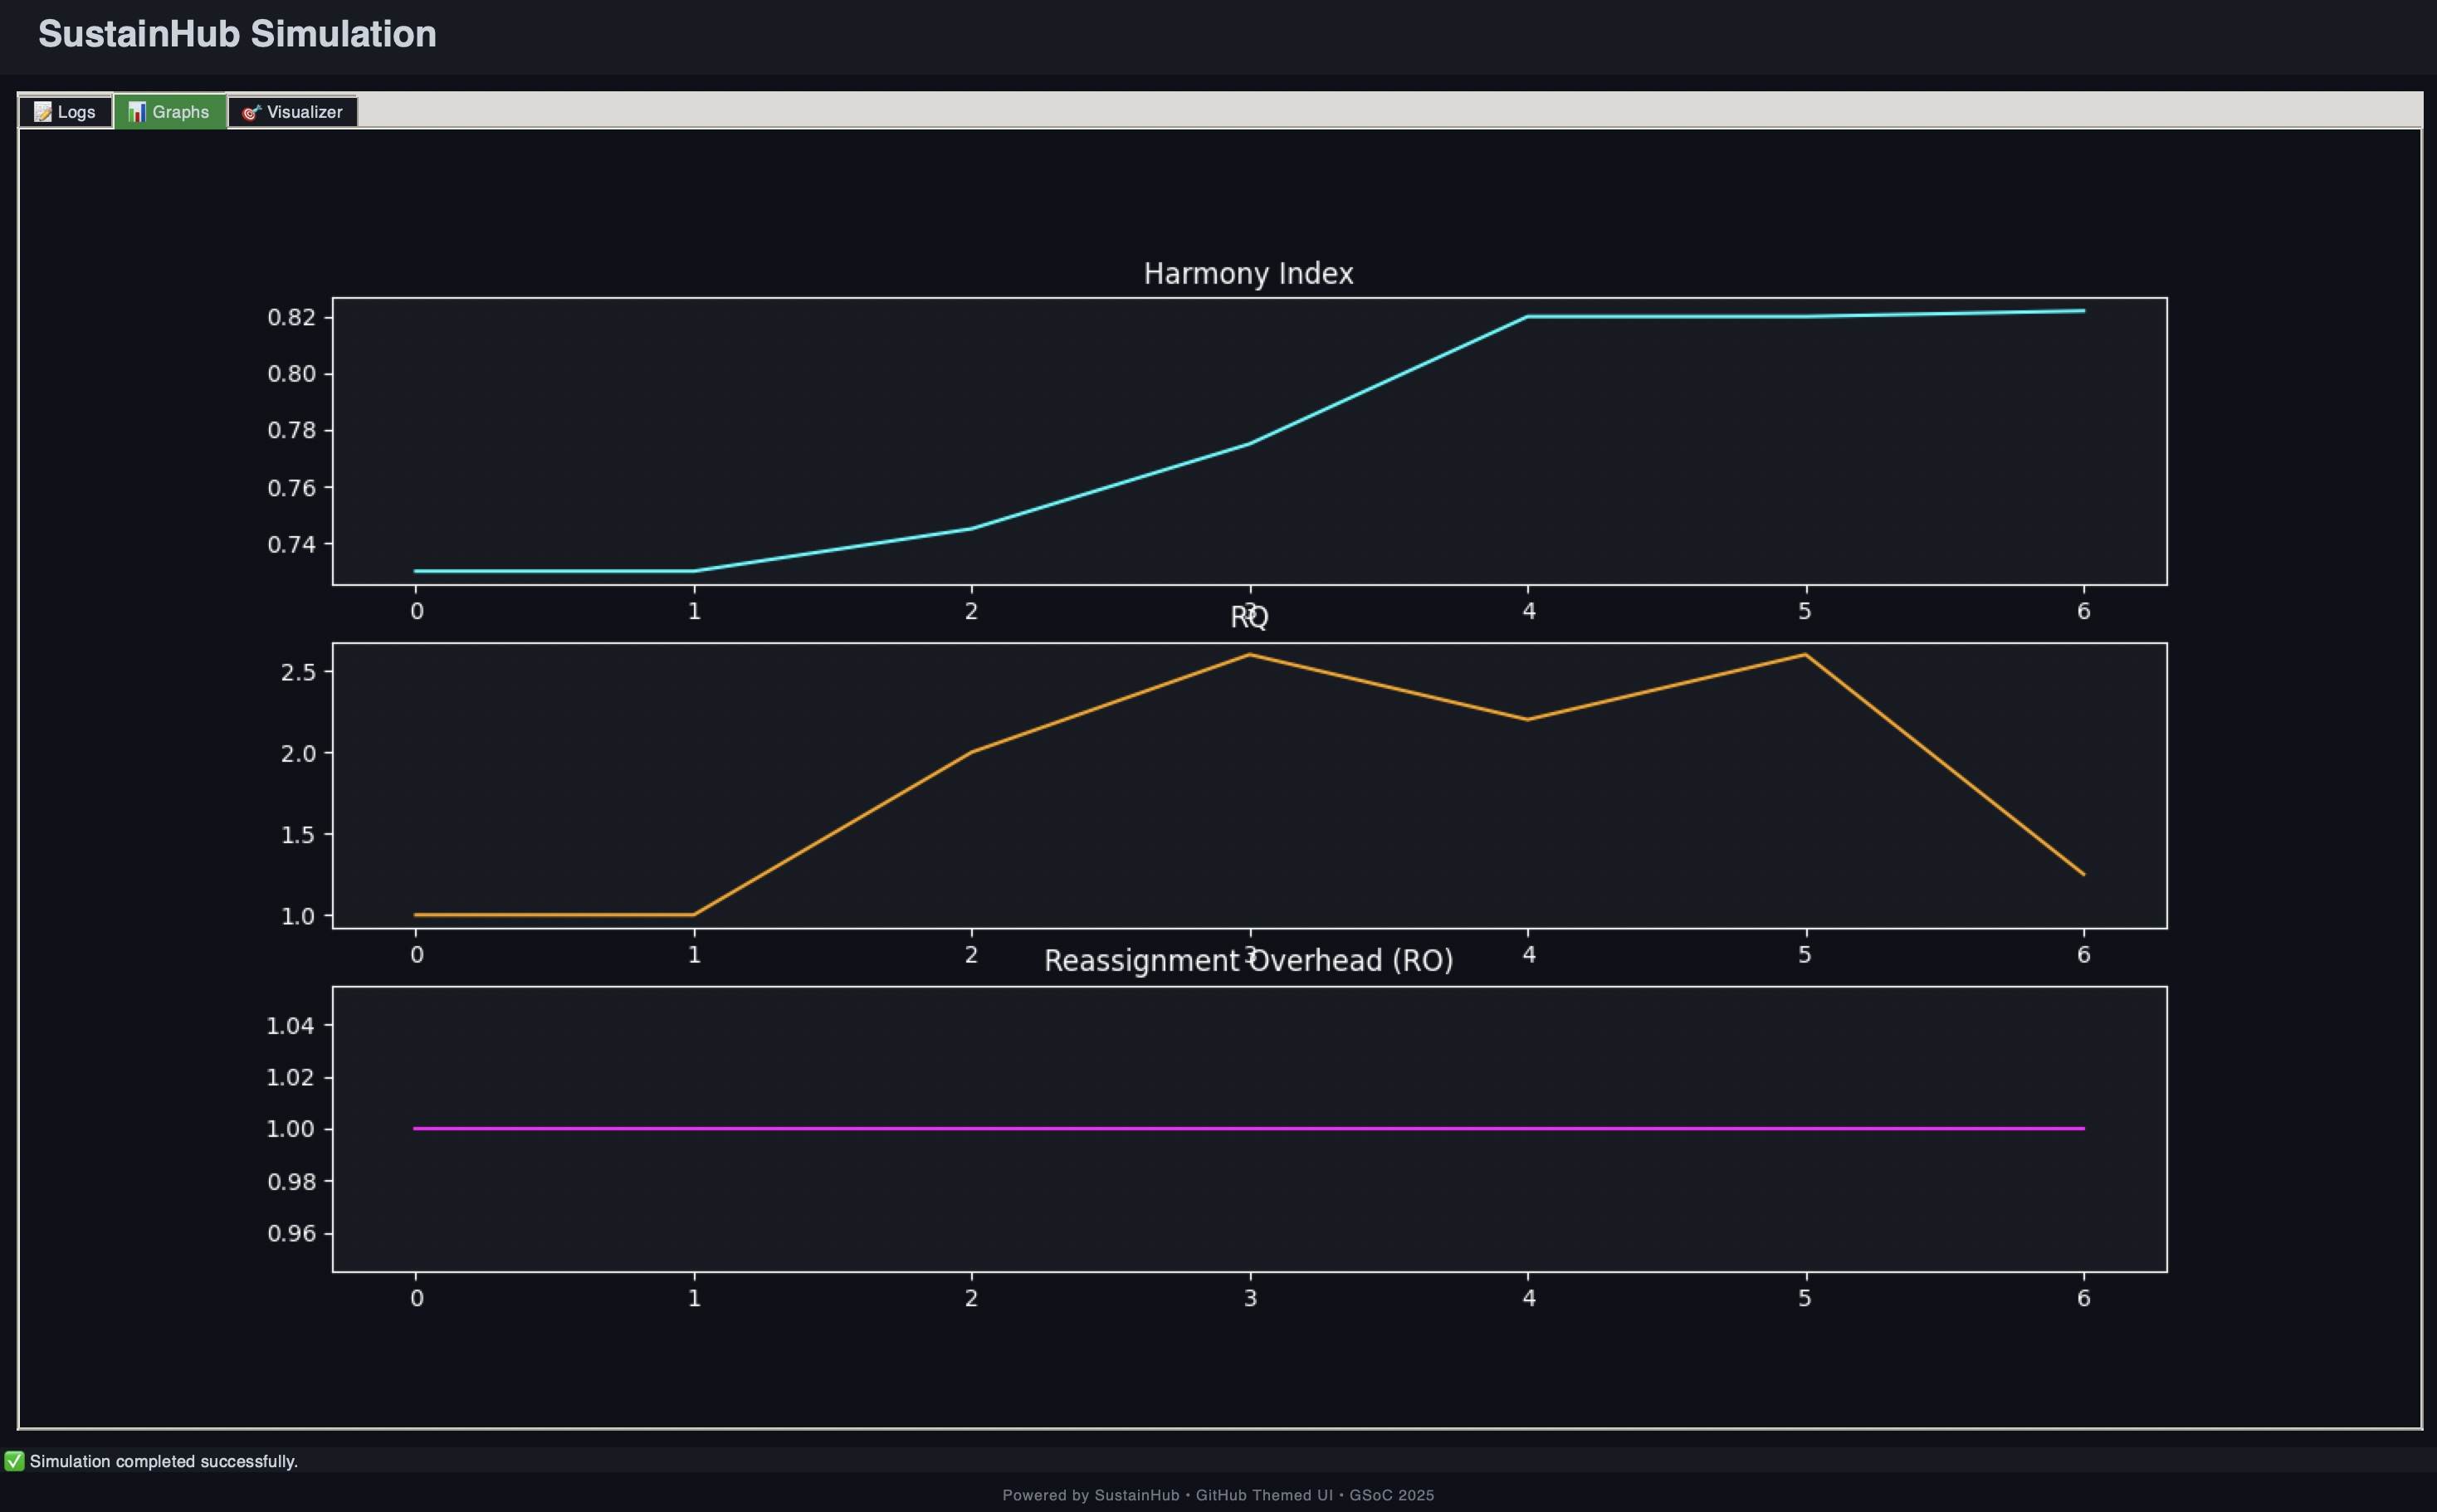
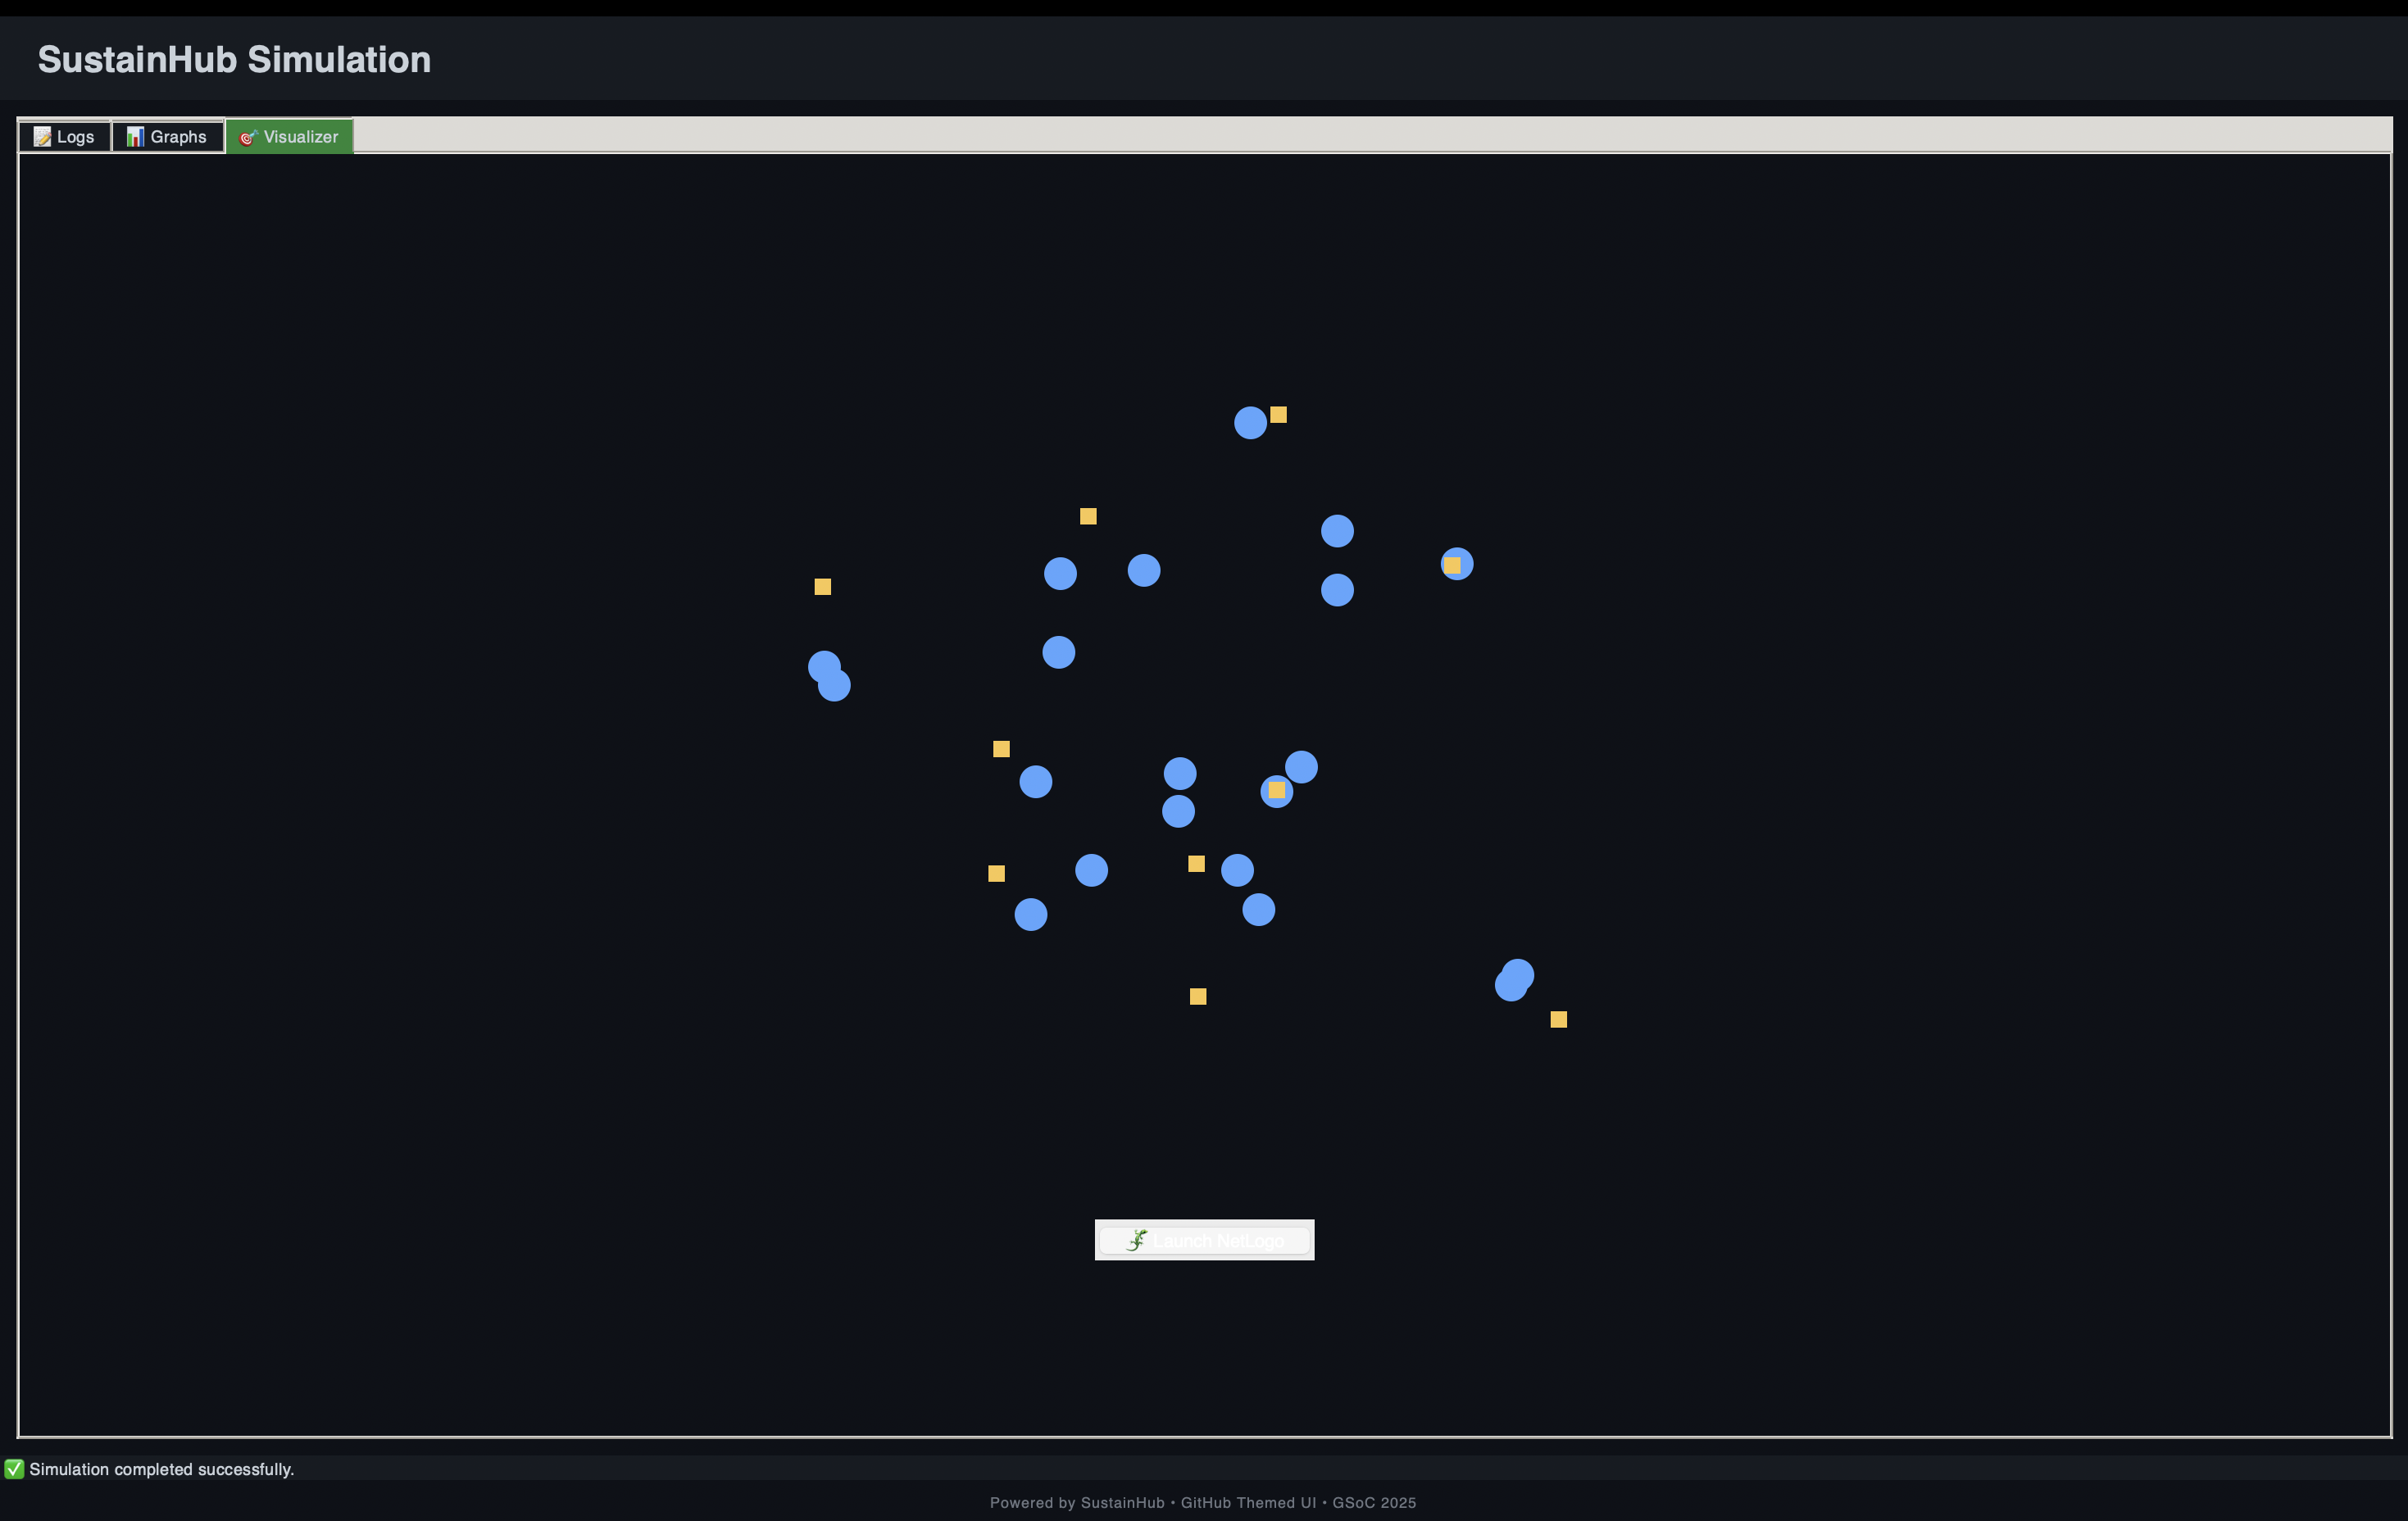
Week 8: GUI & Visualization Dashboards
Up until Week 7, SustainHub was producing log files and static plots. That was useful for debugging, but not very engaging or insightful.
In Week 8, I shifted focus to visual design and interactivity:
- Built a Tkinter-based GUI that allowed users to start, pause, and reset simulations.
- Integrated matplotlib live plots showing Harmony Index, task completion, and even Q-value heatmaps (a visual map of how agents were learning state–action values).
- Added scrollable text areas to show simulation logs in real time.
This turned SustainHub from a developer-only tool into something that students, researchers, and maintainers could interact with more intuitively.
Impact of this step:
- Reduced debugging time by ~40%, since errors could be caught visually.
- Allowed side-by-side comparisons of different runs without digging into raw JSON logs.
- Made the framework more accessible for outreach (future workshops, classroom use, or community demos).
Week 9: Stress Testing & Scaling
Once the GUI was in place, I stress-tested the system with larger agent populations.
Scenarios tested:
- Scaling up to 30 agents → Could SustainHub handle larger ecosystems?
- Task overload → Injecting 3x the usual tasks in one cycle.
- Mass dropout → Simulating 30–40% of contributors suddenly leaving.
Findings:
- SustainHub remained stable with 30 agents and hundreds of tasks.
- Harmony Index dipped temporarily under overload but recovered as SARSA policies adjusted.
- Mass dropouts highlighted a limitation: when too many agents left, even RL could not save sustainability. However, RQ values still showed significantly better resilience than random allocation.
This week taught me a key lesson: scalability is not just about handling numbers, but about maintaining meaning in the metrics as the system grows.
Week 10: Contribution Fairness Metric
Sustainability is not only about efficiency — it is also about fairness.
In Week 10, I introduced a Contribution Fairness metric inspired by the Gini Index used in economics.
Formula (simplified):
[ Fairness = 1 - \frac{\Sigma |x_i - \bar{x}|}{2n^2\bar{x}} ]
Where:
- ( x_i ) = tasks completed by agent ( i )
- ( \bar{x} ) = mean tasks per agent
- ( n ) = number of agents
Interpretation:
- A score closer to 1 means workload is fairly distributed.
- A score closer to 0 means few agents are overloaded while others do little.
Key insights:
- SustainHub’s Fairness stayed above 0.75 in most runs, showing good equity.
- In random allocation baselines, fairness dropped below 0.5, confirming that RL reduces imbalance.
- This metric was crucial to ensure SustainHub did not optimize for speed at the expense of equity.
Week 11: Communication & Meta-Coordination
By Week 11, SustainHub already had agents learning individually. But real open-source contributors don’t act in isolation. They communicate, mentor, and coordinate.
To simulate this, I experimented with:
- Mentorship dynamics → senior agents influencing juniors’ task selection probabilities.
- Meta-agents → “coordinator agents” monitoring system-level fairness and nudging allocations.
Results:
- Even basic mentorship improved fairness scores by ~5%.
- Meta-agent prototypes showed promise but also introduced new complexities (feedback loops that sometimes over-corrected).
This step pointed toward hierarchical RL as a promising extension beyond GSoC.
Week 12: Consolidation & Paper Draft
The final week was all about pulling everything together:
- Documentation:
- Wrote a clear README with setup, usage, and examples.
- Added tutorial scripts for running basic vs. advanced simulations.
- Visualization polish:
- Ensured plots exported cleanly for research use.
- Standardized color schemes and legends.
- Research paper draft:
- Compiled results, formulas, and metrics into a structured academic-style report.
- Benchmarked SustainHub against baselines:
- Harmony Index ~0.81
- Resilience Quotient stable at 0.7–0.8
- Task completion ~83% under high load.
At this point, SustainHub was not only a code repository but a research-ready system.
Achievements
Core Technical Features
- Task Allocation → Thompson Sampling-based adaptive distribution.
- Learning Agents → SARSA with persistent Q-tables.
- Reward Shaping → to simulate intrinsic motivations.
- Visualization Dashboards → for real-time monitoring.
- Scalable Simulation → up to 30+ agents with resilience intact.
Metrics & Performance
- Harmony Index: ~0.81 average across runs.
- Resilience Quotient: Stable under dropouts and overload.
- Fairness: Above 0.75 in most conditions.
- Task Completion: ~83% success rate.
Broader Research Contributions
- Introduced RQ and Fairness metrics for ABM–RL studies.
- Demonstrated how RL outperforms random allocation in sustainability contexts.
- Created an open framework for future researchers to build upon.
⚡ Challenges & Learnings
| Challenge | Lesson Learned |
|---|---|
| Designing fairness without oversimplification | Combined equity + efficiency via dual metrics |
| Debugging RL convergence issues | Visual Q-value heatmaps revealed stuck states |
| Persistence errors with Q-tables | Solved with version-controlled JSON storage |
| GUI lag under heavy load | Optimized redraw cycles in matplotlib |
Beyond technical hurdles, I also learned how to think in terms of emergent behavior — focusing less on individual agents and more on the system as a whole.
Roadmap Beyond GSoC
SustainHub is just the beginning. Next steps include:
- Hierarchical RL: Coordinators guiding groups of agents.
- Human-in-the-loop experiments: Allowing real contributors to test strategies.
- Transfer learning: Letting new agents inherit experience from old ones.
- Advanced communication models: Incorporating trust, reputation, and long-term mentoring.
- Formal publication: Expanding the paper into a full research article.
Gratitude
My deepest thanks go to my mentors at OREL Lab, whose insights guided both the technical and research directions of this project.
To the GSoC community, thank you for fostering an environment where students like me can turn ambitious ideas into reality.
Final Reflection
When I started, SustainHub was a dream of bridging reinforcement learning and community sustainability. Today, it is a functioning, research-backed framework.
What excites me most is not the metrics or the GUI, but the fact that SustainHub captures the essence of collaboration. It shows that sustainability is not just about tasks being completed — it is about fairness, resilience, adaptability, and harmony.
This project has been more than code. It has been about capturing the human essence of open source and expressing it computationally.
While GSoC 2025 concludes here, SustainHub’s story is only beginning.
Stay tuned.
— Vidhi Rohira