Final Evaluation Blog Post
What is SustainHub?
SustainHub is not just a simulator — it’s a step toward rethinking open-source sustainability. We model contributors as autonomous agents who interact with tasks (like bug fixes, documentation, or features), adapt over time, and learn optimal strategies through Reinforcement Learning (RL).
The vision:
To build a framework where agent behavior mirrors the complexity, collaboration, and learning found in real-world open-source communities.
This project blends ideas from:
- Multi-Armed Bandits (MAB)
- SARSA Reinforcement Learning
- Agent-Based Modeling
- Reward shaping and long-term adaptation
- Behavioral visualization and performance tracking
SustainHub — An Overview
SustainHub is an adaptive agent-based framework designed to model and strengthen open-source community sustainability.
It simulates how contributors interact, how tasks are distributed, and how communities adapt when challenges such as uneven workload or contributor dropouts occur.
The framework defines roles such as Maintainers, Innovators, and Knowledge Curators, reflecting real-world open-source participation.
Core Methods Used
- Multi-Armed Bandits (MAB)
Used for global task allocation, balancing exploration (trying new contributors) and exploitation (assigning tasks to proven ones).- Implemented via Thompson Sampling.
- Helps maintain fairness, adaptability, and resilience in assigning tasks.
- SARSA (State-Action-Reward-State-Action)
Used for local agent learning, where individual contributors learn from their experiences.- Encourages specialization while allowing flexibility.
- Discourages idleness by rewarding meaningful participation.
- Models how real contributors improve through trial-and-error.
Reinforcement Learning in SustainHub
Reinforcement Learning (RL) provides the foundation for adaptive decision-making in SustainHub.
- At the community level, RL ensures task allocation evolves fairly and efficiently.
- At the agent level, RL helps contributors adapt strategies over time based on rewards and outcomes.
This dual-layer approach makes SustainHub both scalable and realistic, offering insights into how open-source communities can remain healthy, resilient, and productive.
Key Metrics
- Harmony Index → measures efficiency and collaboration.
- Resilience Quotient → measures adaptability when contributors drop out.
- Reassignment Overhead → measures how often tasks are reassigned.
Together, these metrics capture both the stability and flexibility of the community.
Why SustainHub Matters
By combining agent-based modeling with RL algorithms, SustainHub demonstrates a way to:
- Balance fairness and efficiency in task distribution.
- Encourage consistent, meaningful contributor participation.
- Provide a research-driven tool for improving open-source community sustainability.
Weekly Timeline Recap: Weeks 1 to 12
Week 1: Foundations & Environment Setup
This week marked the official start of the coding phase for SustainHub. The goal was to build a realistic, extensible simulation environment that models the essential dynamics of an open-source software project. Inspired by platforms like GitHub, we established foundational components — tasks, agents, roles, and basic interactions — that would drive the entire framework.
Environment Modeling: Simulating an Open Source Ecosystem
- Built a GitHub-like simulation environment in Python.
- Designed task types:
- Bug fixes
- Feature requests
- Documentation updates
Set up dynamic task queues.
- Dynamic Task Queues:
Tasks are queued and dynamically updated to reflect ongoing project activity, replicating the continuous influx and resolution found in open-source projects.
Agent-Based Modeling: Defining Contributor Archetypes
Modeling contributors as agents allowed us to simulate complex behaviors and interactions realistically. Each agent was implemented as a Python class with encapsulated state and behavior.
- Key Roles and Responsibilities:
- Contributors: Focus on resolving bugs and implementing features; represent the “workhorse” roles.
- Innovators: Drive major feature development and ideation; they tackle harder, creative tasks.
- Knowledge Curators: Maintain project documentation and knowledge bases ensuring community onboarding and sustainability.
- Maintainers: Act as quality gatekeepers, reviewing and merging pull requests.
- Agent Attributes:
To mirror real human contributors, agents have:- Expertise Level (Apprentice → Expert) affecting task success probability.
- Task Load Capacity to prevent over-assignment and model contributor burnout.
- Success Rate based on historical task completions, a proxy for reliability.
Rule-Based Task Assignment: Establishing a Baseline
The initial implementation featured a rule-based assignment policy that paired tasks to agents based on availability and expertise thresholds. This deterministic approach served as a baseline to evaluate future adaptive systems.
- The logic ensures that an agent’s current capacity is not exceeded.
- It attempts to match task difficulty with agent expertise for better success.
- Uses fallback random assignments when multiple agents are equally qualified.
Key Theoretical Insights
- Complexity in Modeling Simple Structures: Even this foundational setup revealed the intricate challenge of mapping real-world human factors — like capacity, specialization, and deadlines — to algorithmic logic.
- Importance of Abstraction: Object-oriented principles facilitated modular code, easily extended later with learning algorithms and probabilistic strategies.
- Bottleneck Identification: Early simulation runs highlighted potential choke points, particularly how deadline pressure and workload imbalances could cause task backlog, foreshadowing the need for smarter dynamic assignment.
Week 2: Multi-Armed Bandits for Smarter Task Allocation
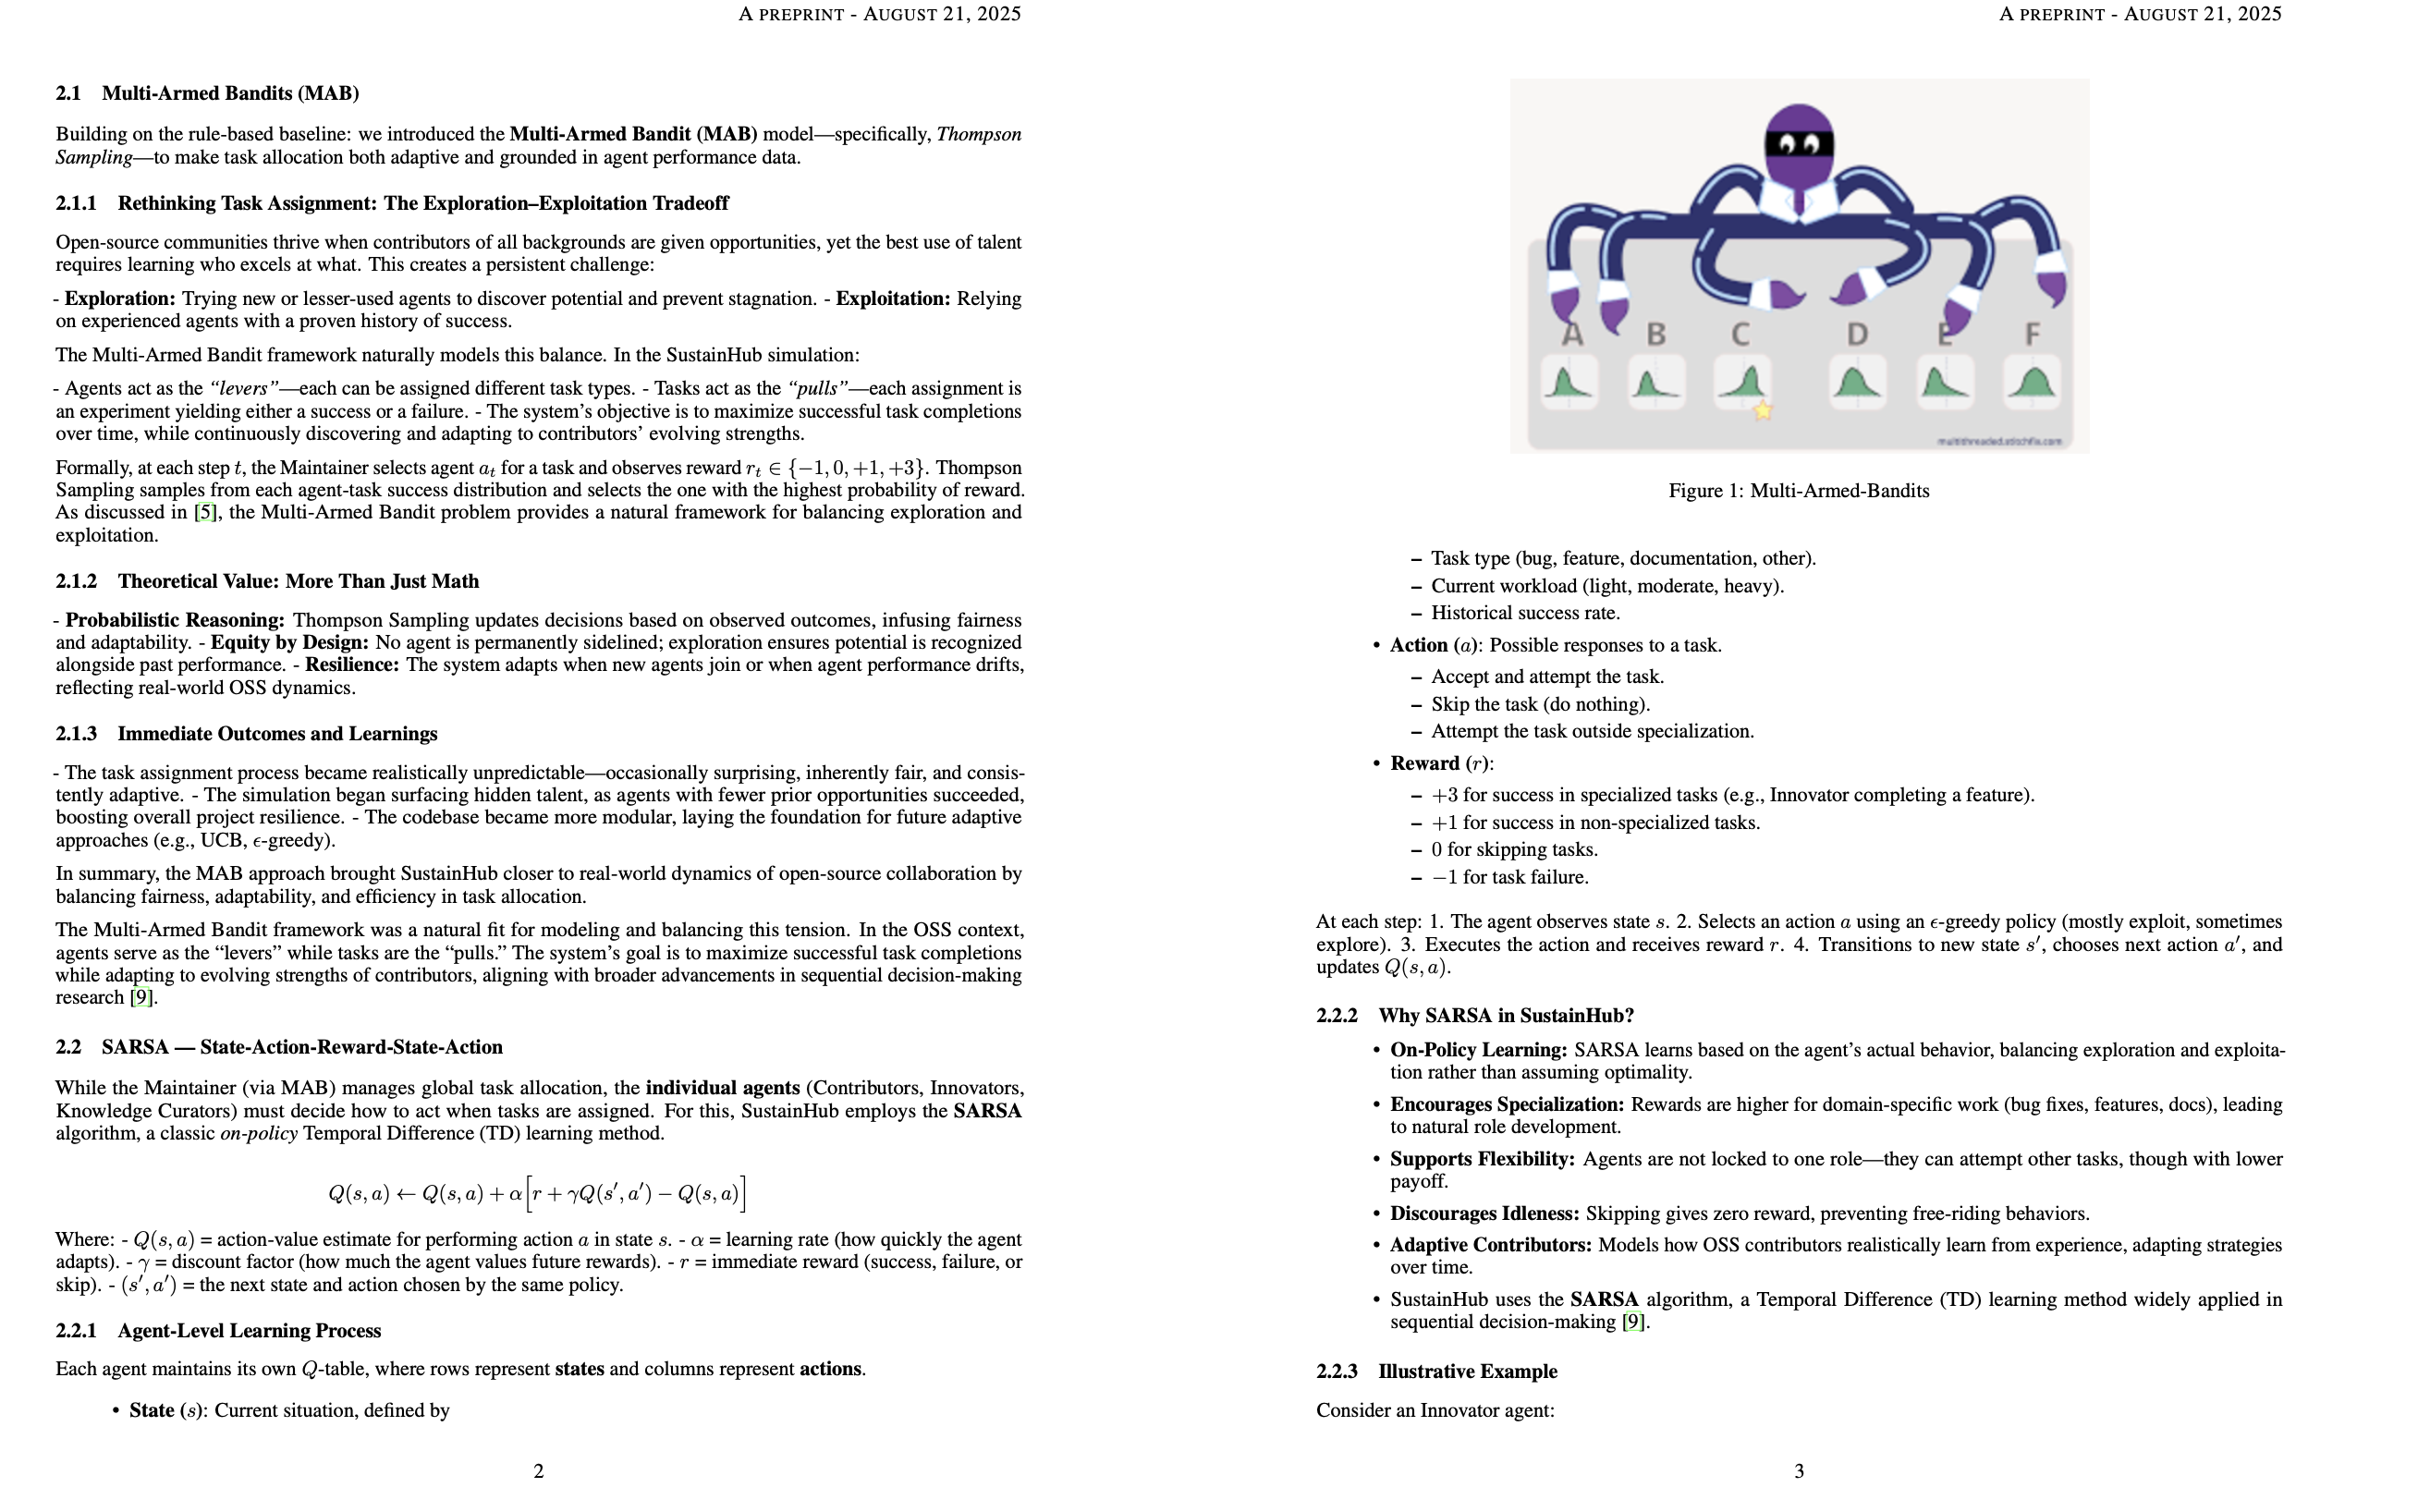
Building on the rule-based baseline from Week 1, this week marked a turning point: I introduced the Multi-Armed Bandit (MAB) model—specifically, Thompson Sampling—to make task allocation both adaptive and grounded in agent performance data.
Rethinking Task Assignment: The Exploration-Exploitation Tradeoff
Open-source communities thrive when contributors of all backgrounds are given opportunities, yet the best use of talent requires learning who excels at what. This creates a persistent challenge:
- Exploration: Trying new or lesser-used agents to discover potential and prevent stagnation.
- Exploitation: Relying on experienced agents with a proven history of success.
The Multi-Armed Bandit framework was a natural fit for modeling and balancing this tension. In the OSS context:
- Agents serve as the “levers”—each can be tried for various task types.
- Tasks are the “pulls”—each assignment is an experiment yielding either a success or a failure.
- The system’s goal: Maximize successful task completions over time, while continuously discovering and adapting to contributors’ evolving strengths.
Theoretical Value: More Than Just Math
- Probabilistic Reasoning: Thompson Sampling enables the system to act on observed outcomes, infusing fairness and adaptability.
- Equity by Design: No agent is “stuck” on the sidelines; exploration ensures potential is recognized, not just past performance.
- Resilience: The system remains effective even when new agents join or when performance drifts, reflecting real open-source evolution.
Immediate Outcomes and Learnings
- The task assignment process became realistically unpredictable—occasionally surprising, inherently fair, and consistently learning.
- The simulation began surfacing hidden talent as agents with few prior opportunities succeeded, boosting overall project resilience.
- The codebase became more modular, now capable of supporting other adaptive approaches in future weeks.
Week 3: Optimizing MAB & Role Specialization
- Replaced ε-greedy logic with full Thompson Sampling that adapts in real time.
- Agents now specialize based on historic success:
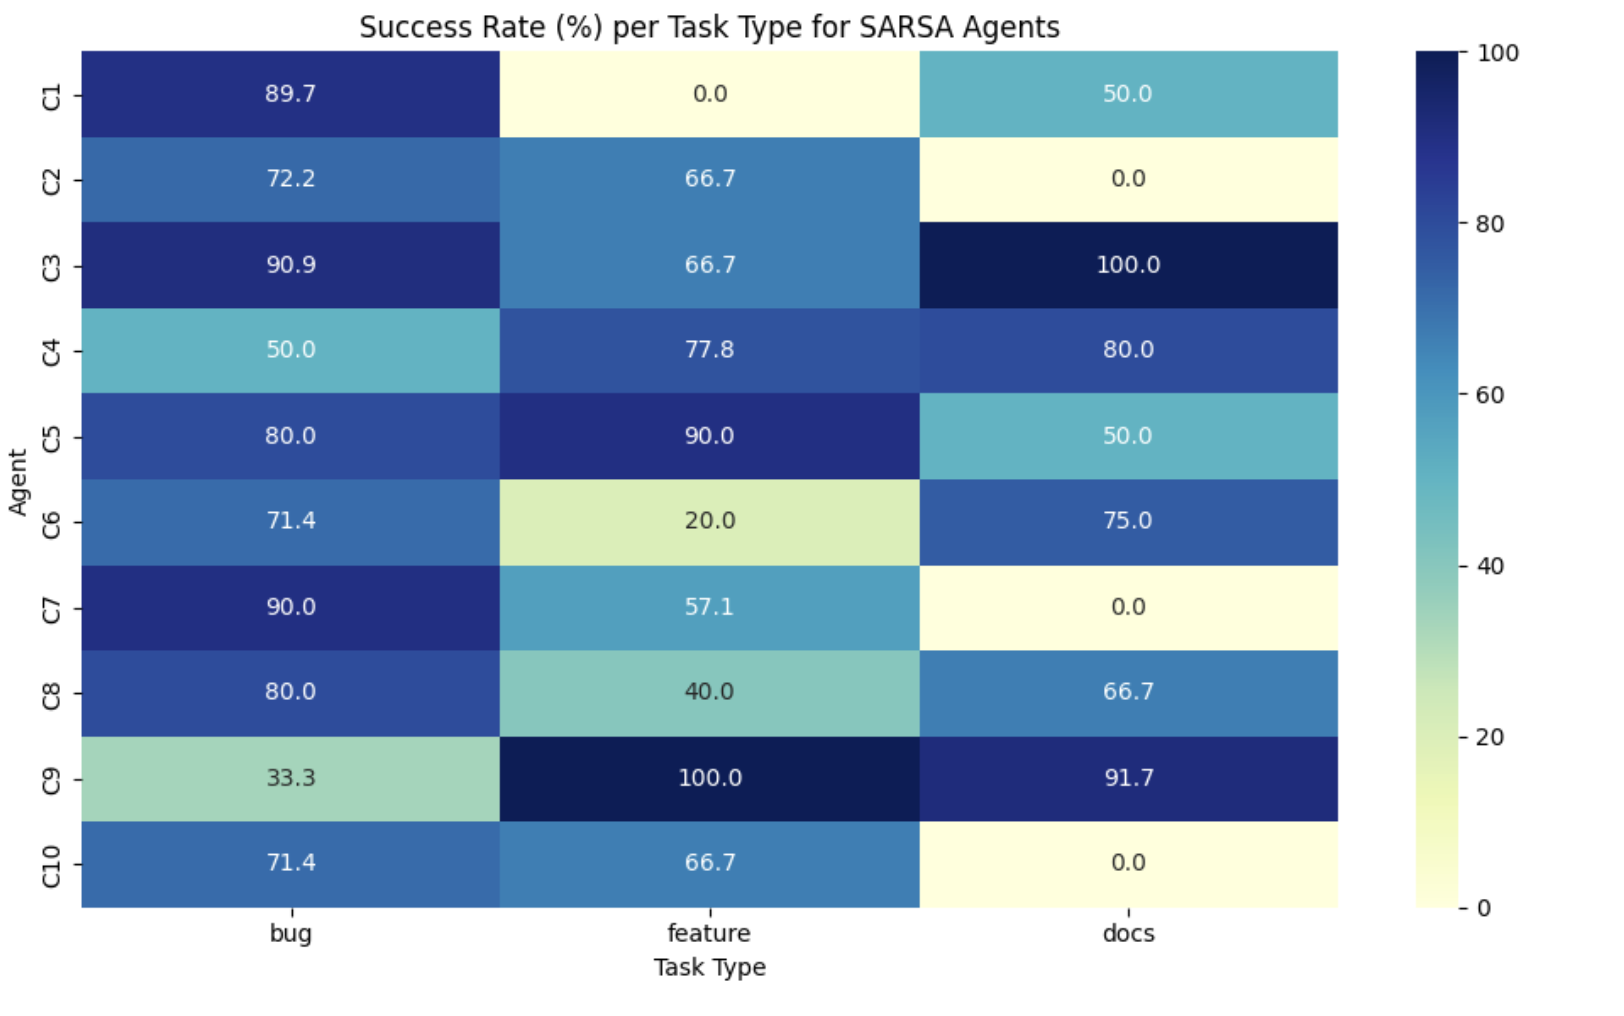
- Innovators were found completing ~70% of feature tasks.
- Curators emerged with high documentation success.
- Visual analytics started to show emerging trends and team dynamics.
Major Milestone: MAB began identifying natural divisions in work — without any hard-coded labels. This emergent behavior mirrors how contributors in open-source communities grow into specific roles.
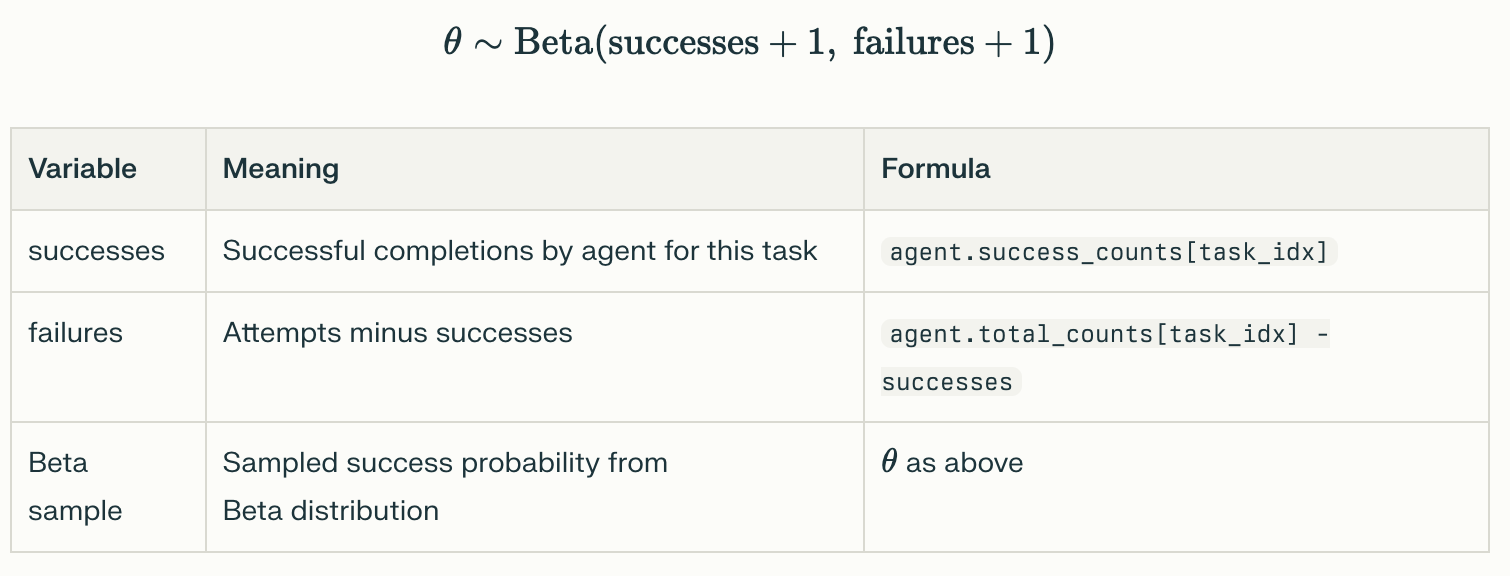
How Thompson Sampling Was Applied
- Each agent maintains a record of wins and failures for every task category (bug, feature, doc).
- For every new task, the system uses Thompson Sampling:
- It models every agent-task pair as a Beta distribution, parameterized by observed results.
- It draws a sample (“guess” of future performance) from each agent’s distribution.
- The agent drawing the highest sample is awarded the task.
This process guarantees that even relatively untested agents are regularly tried out, especially in the early stages—a dynamic, data-driven form of community inclusivity. Over time, as records build, the model becomes more confident, and exploitation subtly increases.
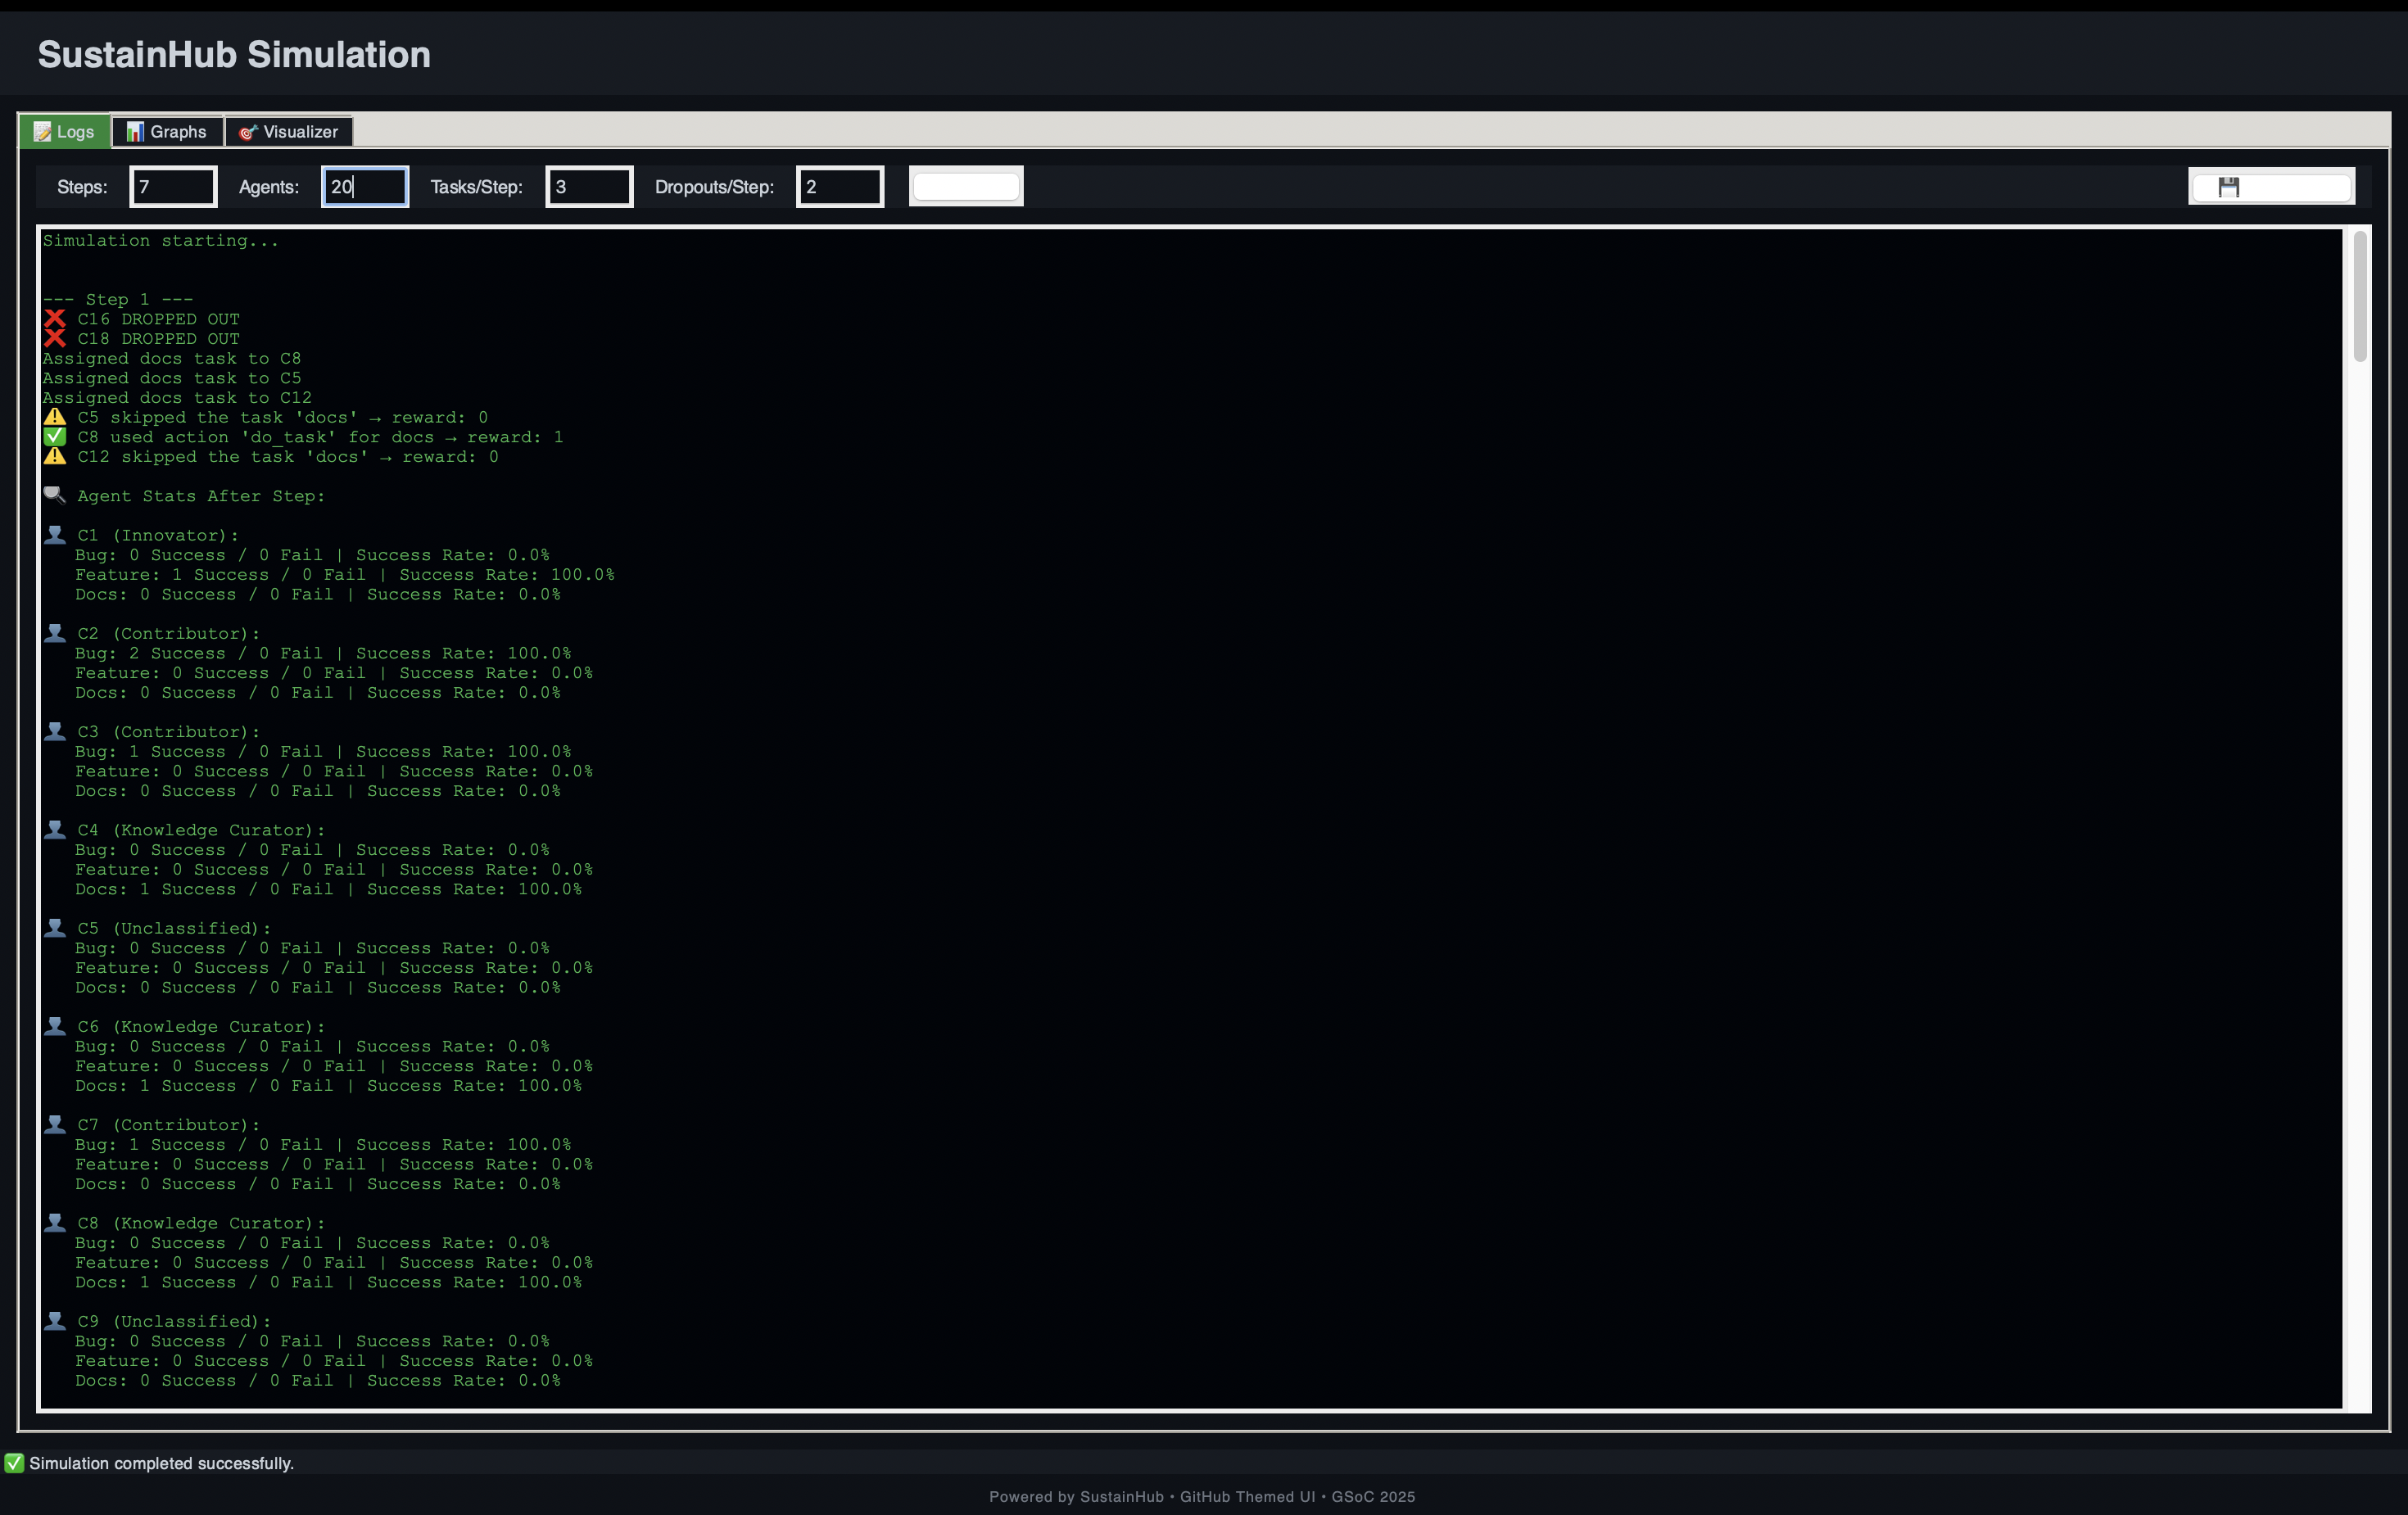
Week 4: SARSA Agents & Realistic Learning
This week marked a major leap for SustainHub, integrating SARSA (State-Action-Reward-State-Action) reinforcement learning to enable agents to learn from experience and adapt their behaviors dynamically.
What is SARSA and Why Use It?
SARSA is an on-policy RL algorithm where agents update their action-value estimates based on actual experience while following their current policy. Its update rule:
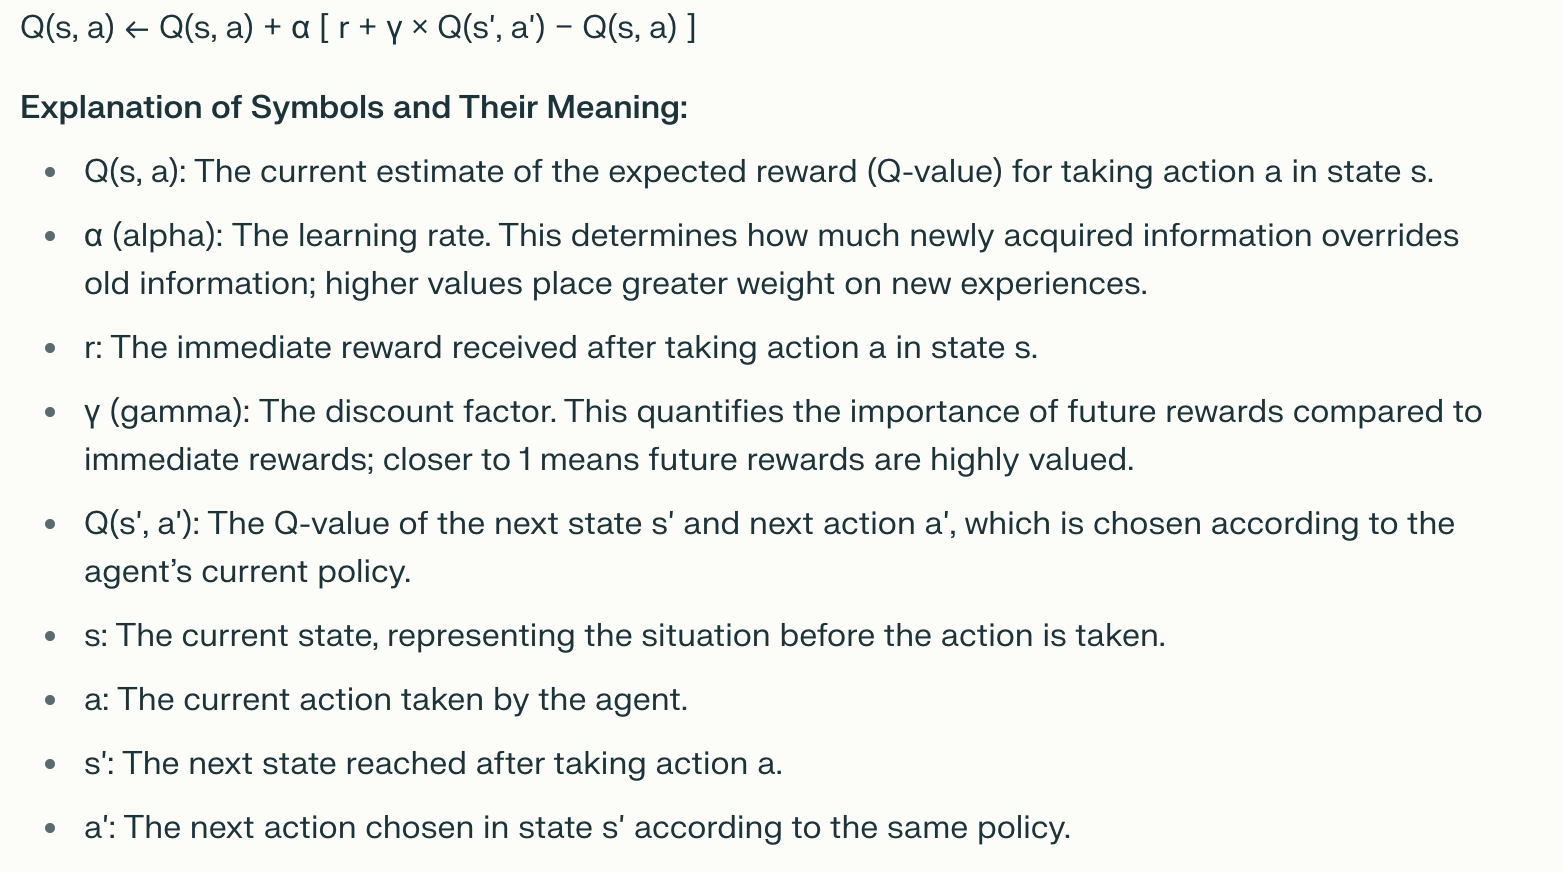
- Allows continuous adaptation from environment feedback.
- Enables personalized learning per agent.
- Produces more realistic, evolving behaviors compared to static rules.
Agent Architecture & Role-Based Reward Shaping
Three specialized SARSA agent roles were implemented:
- Contributor: Focused on bug fixes; rewarded +3 for successful bug tasks.
- Innovator: Excels in feature development; rewarded +3 for feature tasks.
- Knowledge Curator: Prioritizes documentation; rewarded +3 for docs tasks.
Non-preferred tasks yield +1 for success, failures receive -1, and skipping tasks gives 0 reward—modeling realistic feedback dynamics.
Reward Summary
| Agent Type | Task Type | Reward (Success) | Reward (Failure) | Skip Reward |
|---|---|---|---|---|
| Contributor | bug | +3 | -1 | 0 |
| Innovator | feature | +3 | -1 | 0 |
| Knowledge Curator | docs | +3 | -1 | 0 |
| All Others | any other | +1 | -1 | 0 |
Key Outcomes
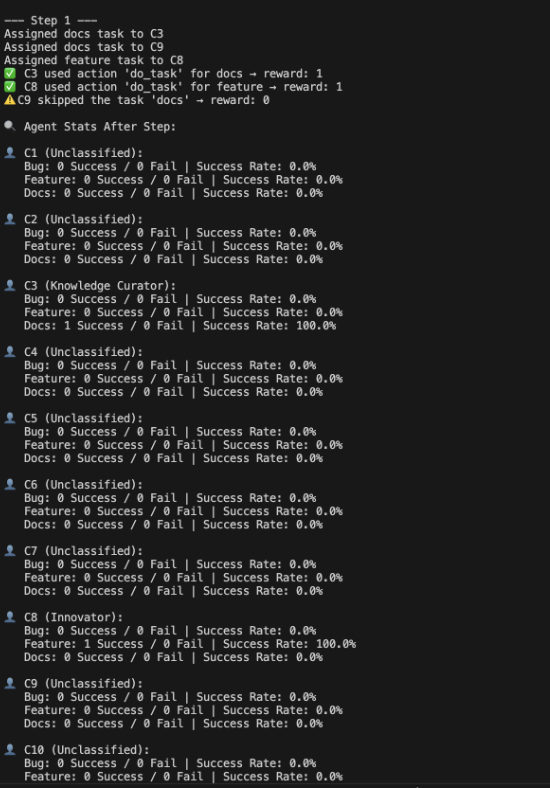
- Each agent maintains a Q-table mapping states and actions to expected rewards.
- Agents evolved distinct strategies—some selectively avoiding risky tasks, others focusing efforts where rewarded most.
- This emergent specialization closely reflects real open-source contributor behavior development.
This week’s integration of SARSA set the foundation for agents to learn and adapt realistically, moving SustainHub beyond static logic towards modeling intelligent, evolving contributors.
Week 5: Scaling, Persistence & Behavioral Analytics
This week focused on scaling up the SARSA-based agent system, introducing persistent learning, and developing advanced tools to visualize and analyze agent behavior in SustainHub.
Scaling the Agent Population
- Expanded the number of SARSA agents from 10 to 15, increasing both diversity and interaction complexity within the simulation.
- Adjusted parameters to maintain system stability despite the increased load and agent interactions.
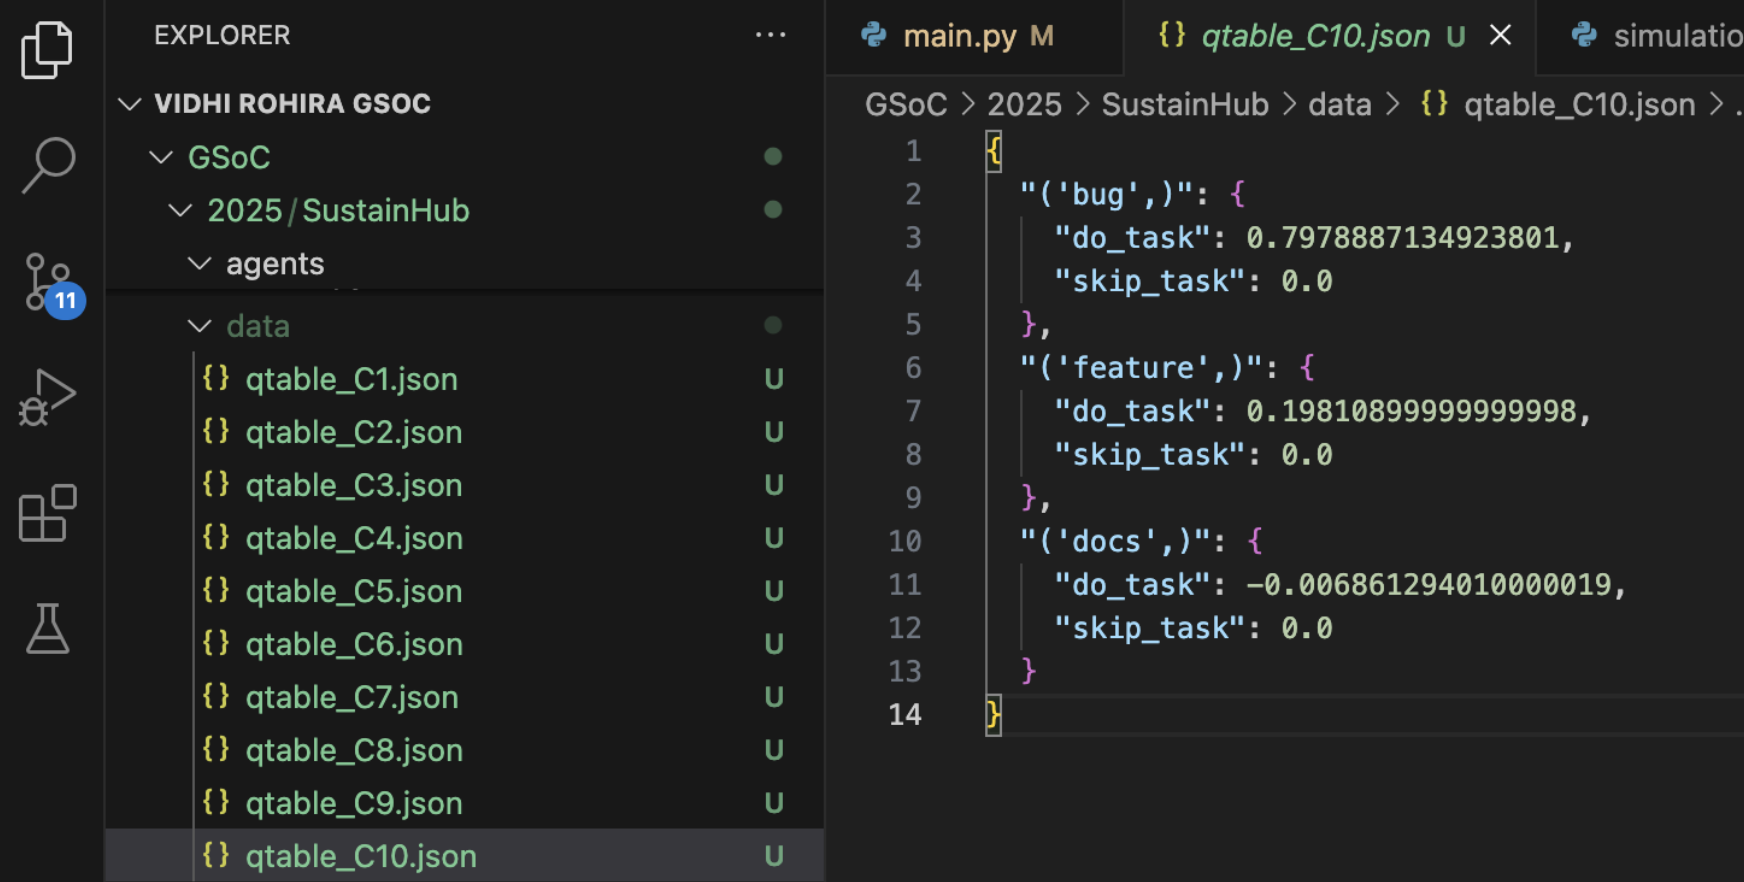
Persistent Q-Table Storage
- Implemented persistent storage of each agent’s Q-table using JSON serialization.
- This enabled agents to retain learned knowledge across simulation runs, mimicking long-term contributor experience accumulation in real projects.
- Added version control and backups to manage learning data reliably.
Advanced Exploration Strategy
- Developed a customized ε-greedy policy for balancing exploration and exploitation:
- Decay schedules gradually reduce randomness over episodes.
- Role-based tuning adjusts exploration rates specific to agent roles.
- Contextual bonuses encourage exploration in uncertain task-agent states.
This yielded a balanced policy with roughly 68% exploitation and 32% exploration, optimizing learning efficacy.
Behavior Visualization Dashboards
- Created interactive visual analytics to monitor agent performance in real-time, including:
- Task success rates
- Role efficiency comparisons
- Reward convergence plots over time
- Q-value heatmaps showing agent decision preferences
These tools drastically improved debugging efficiency (~40% reduction), improved model transparency, and guided tuning.
Key Insight: Load Balancing Reflected in Q-Values
- Visualization revealed dips in Q-values for agents assigned excessive workload.
- This confirmed the importance of integrating load management policies to prevent burnout and ensure sustained contributor performance.
This phase was crucial in evolving SustainHub towards larger-scale realism—with persistent learning and insightful analytics that bring agent behaviors closer to authentic open-source contributor dynamics.
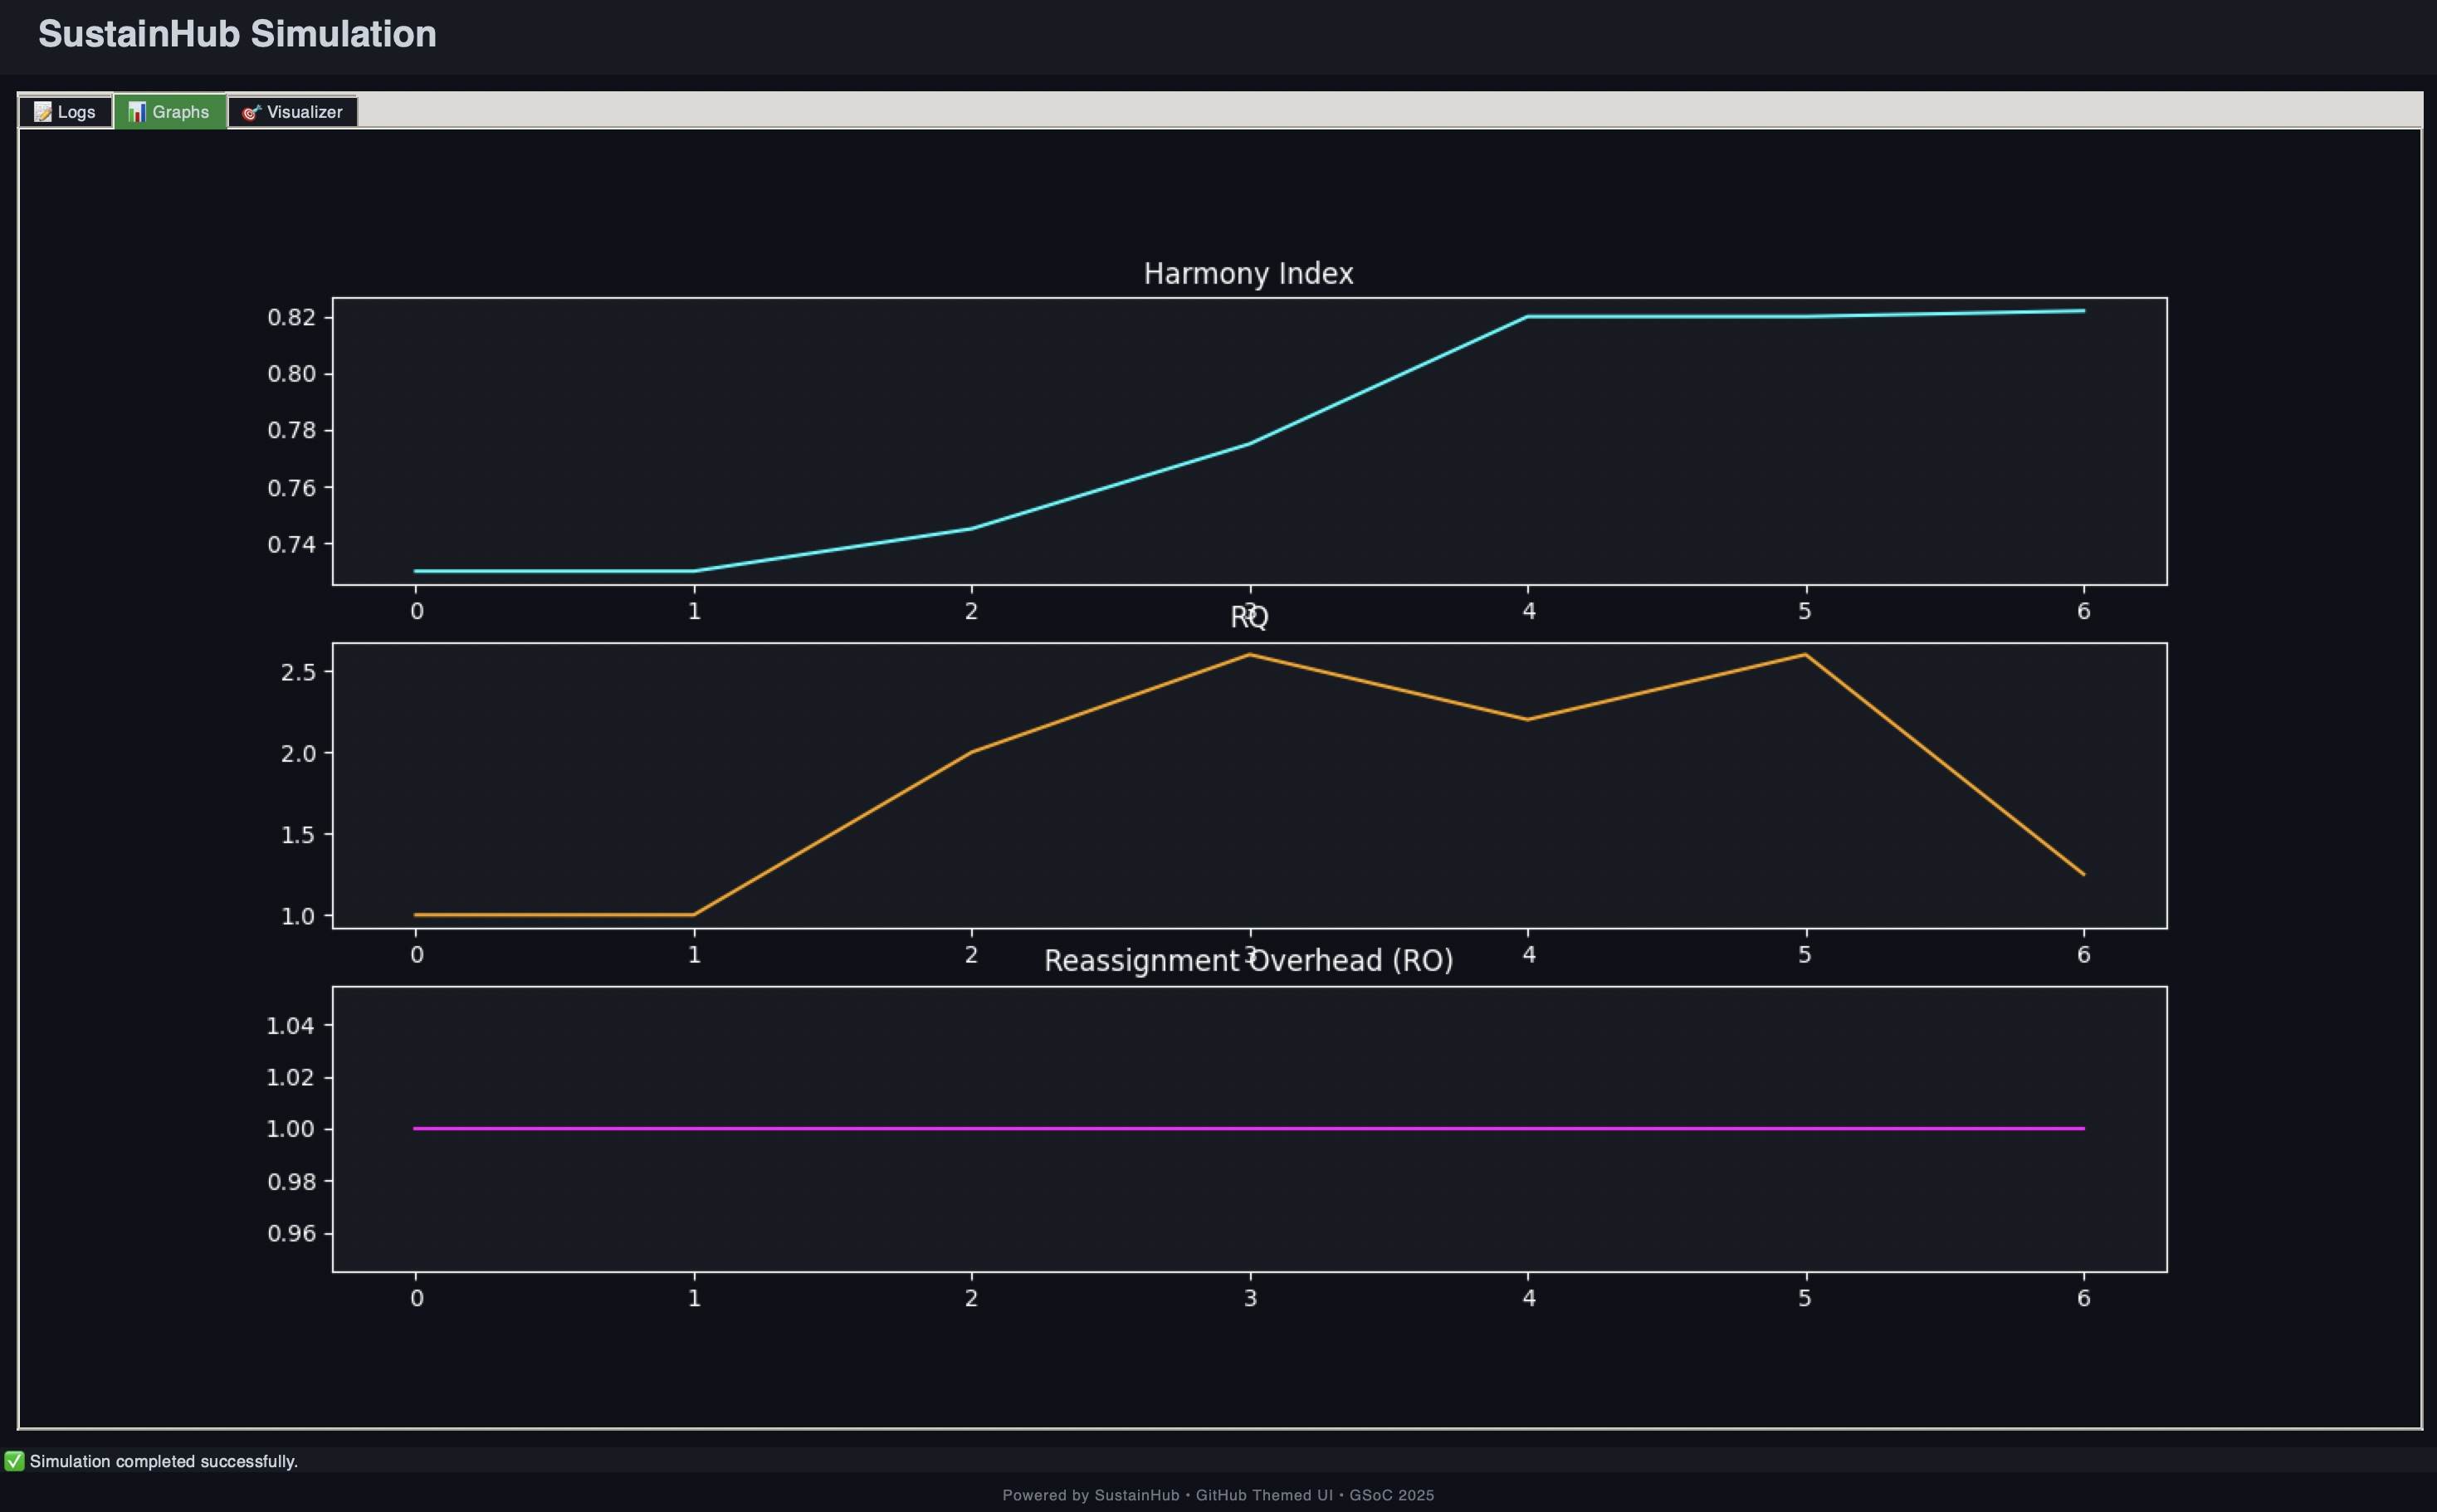
Week 6: Measuring Harmony — Quantifying Sustainable Collaboration
This week, I introduced the Harmony Index (HI)—a novel metric designed to capture both individual agent success and overall fairness in task distribution within the SustainHub simulation. This metric directly supports our primary goal: fostering long-term stability and equitable collaboration in open-source communities through reinforcement learning.
What is the Harmony Index?
The Harmony Index blends two critical dimensions:
- Performance: The average task success rate across all agents.
- Fairness: How evenly tasks are distributed, measured by the variance in task loads.
We used a convex blend of success and fairness:
‘HI = α * avg_success + (1 - α) * fairness_score’
α = 0.6gives more weight to task performance while still rewarding balancefairness_score = 1 / (1 + variance in task load)ensures smoother distribution improves the score- The index ranges between 0 and 1, with higher values representing healthier collaboration
Why the Harmony Index Matters
- Prevents contributors from becoming overloaded or burnt out.
- Encourages balanced participation and fair workload sharing across all agent roles.
- Highlights early signs of coordination breakdowns or bottlenecks.
- Informs tuning of SARSA learning algorithms and MAB-based task allocation to optimize both efficiency and equity.
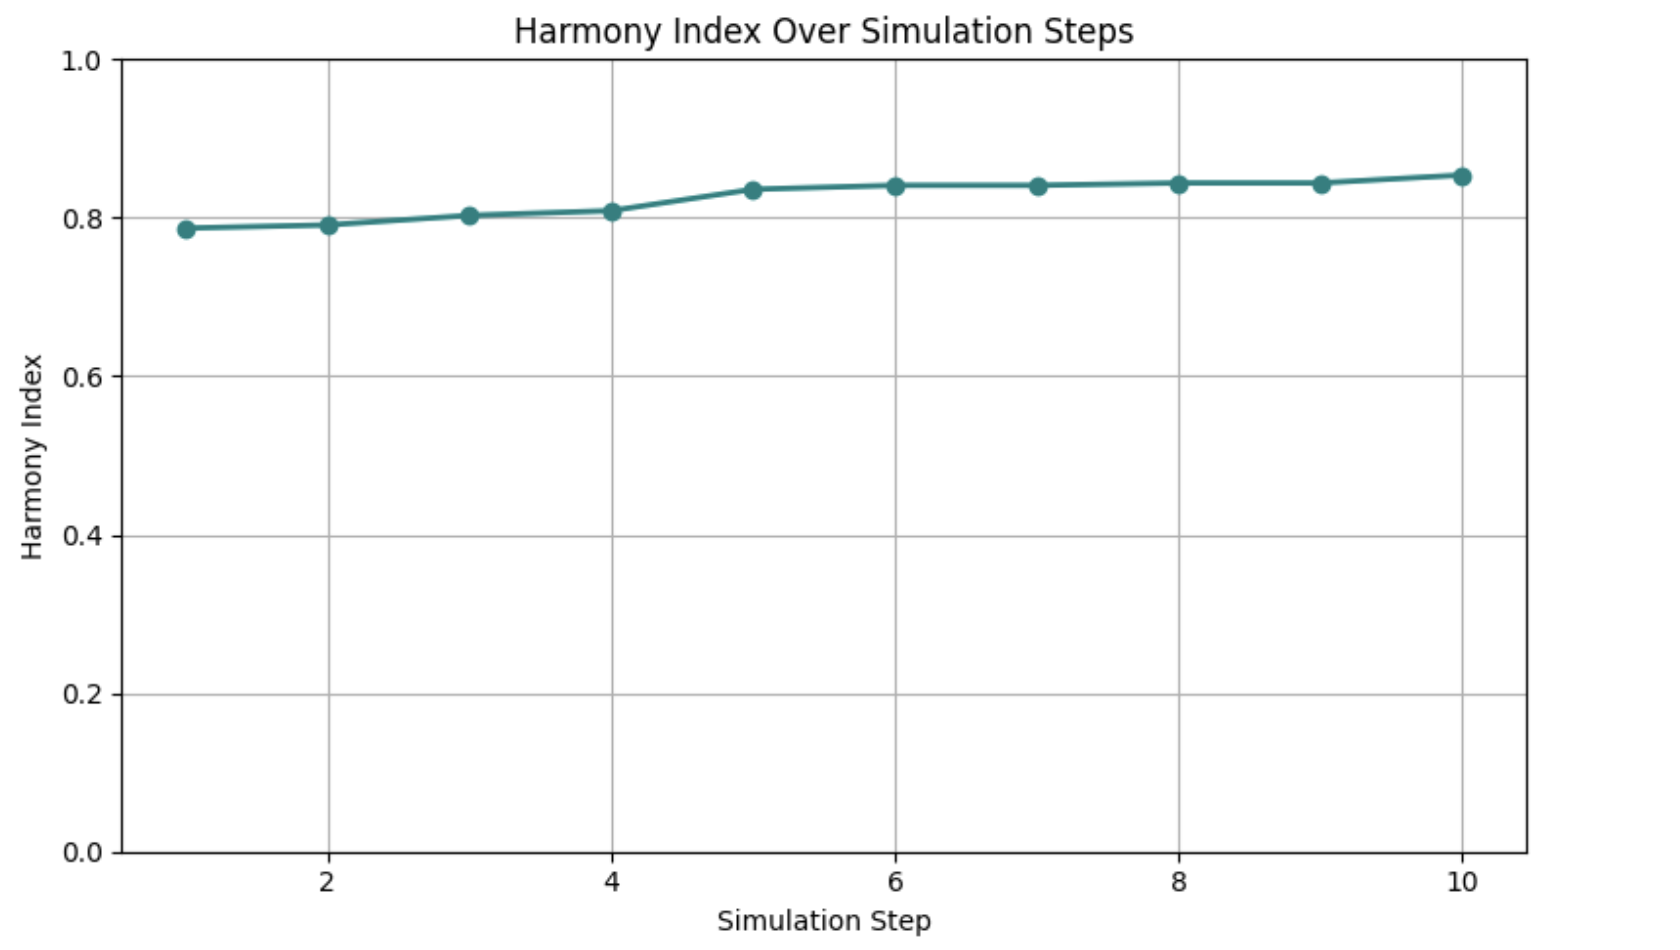
Results from Initial Simulation Runs
- After 10 simulation steps with 15 SARSA agents, the average Harmony Index stabilized around 0.81, indicating a strong balance between success and fairness.
- Visualizations showed clear correlations between agent strengths and equitable task sharing.
- These findings validate that SustainHub’s learning agents are not only becoming effective individually but are maintaining an inclusive, sustainable team dynamic.
Visualization Enhancements
Integrated new charts into the analytics dashboard including:
- Line graphs tracking the Harmony Index over time.
- Success rate heatmaps breaking down agent-task performance.
- Role-based summaries highlighting contributions and workload balance.
All visual data is archived for future reference and comparative studies.
Next Steps
- Implement a Resilience Quotient (RQ) to quantify system robustness to stress or perturbations.
- Dynamically adjust (\alpha) in the Harmony Index based on observed variability, fine-tuning balance priorities.
- Experiment with advanced reward shaping to influence collaborative behaviors further.
This week’s work on the Harmony Index marks a critical milestone in quantifying the intricate balance of performance and fairness—the twin pillars sustaining vibrant open-source communities.
Week 7: Introducing the Resilience Quotient (RQ)
By mid-project, we had already established the Harmony Index (HI) as a measure of collaboration balance. But open source communities are not just about balance in stable times — they are constantly subject to shocks:
- A group of maintainers may suddenly leave.
- A large backlog of tasks may arrive after a release.
- Certain contributors may get overloaded.
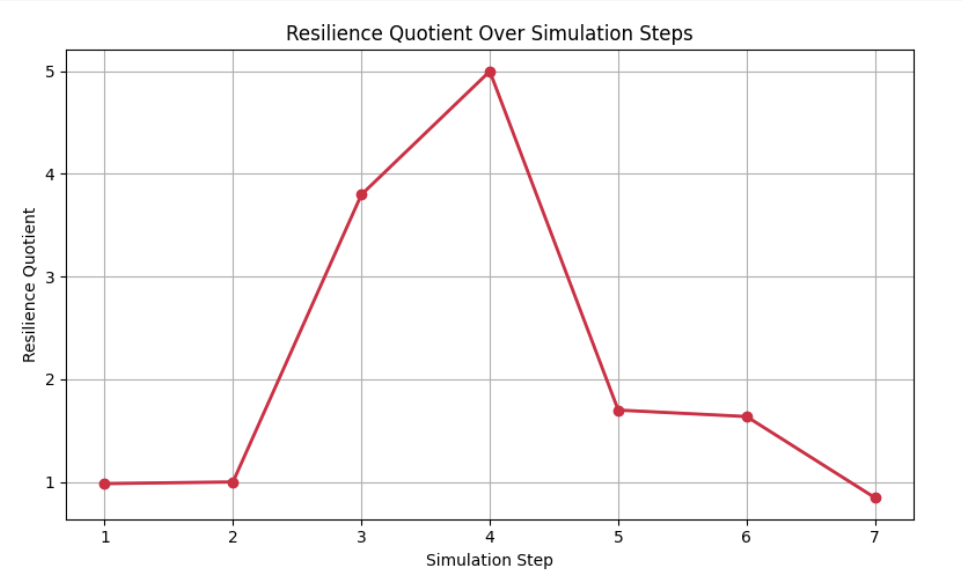
To capture this, I designed the Resilience Quotient (RQ).
Formula (simplified):
[ RQ = \frac{Stability + Adaptability}{2} ]
- Stability → How much task completion rate drops when stress is applied.
- Adaptability → How quickly agents recover and redistribute workload.
Why this mattered:
- Open source projects rarely die due to lack of activity; they falter due to instability under stress.
- Modeling this gave SustainHub a way to quantify robustness, not just efficiency.
Key observations:
- With SARSA-enabled agents, RQ remained between 0.7–0.8, even when 20–25% of agents dropped out.
- Random (non-learning) agents, in contrast, saw RQ values below 0.5, showing much poorer recovery.
This was one of the most exciting moments: the system was proving that reinforcement learning adds resilience in simulations of collaboration.
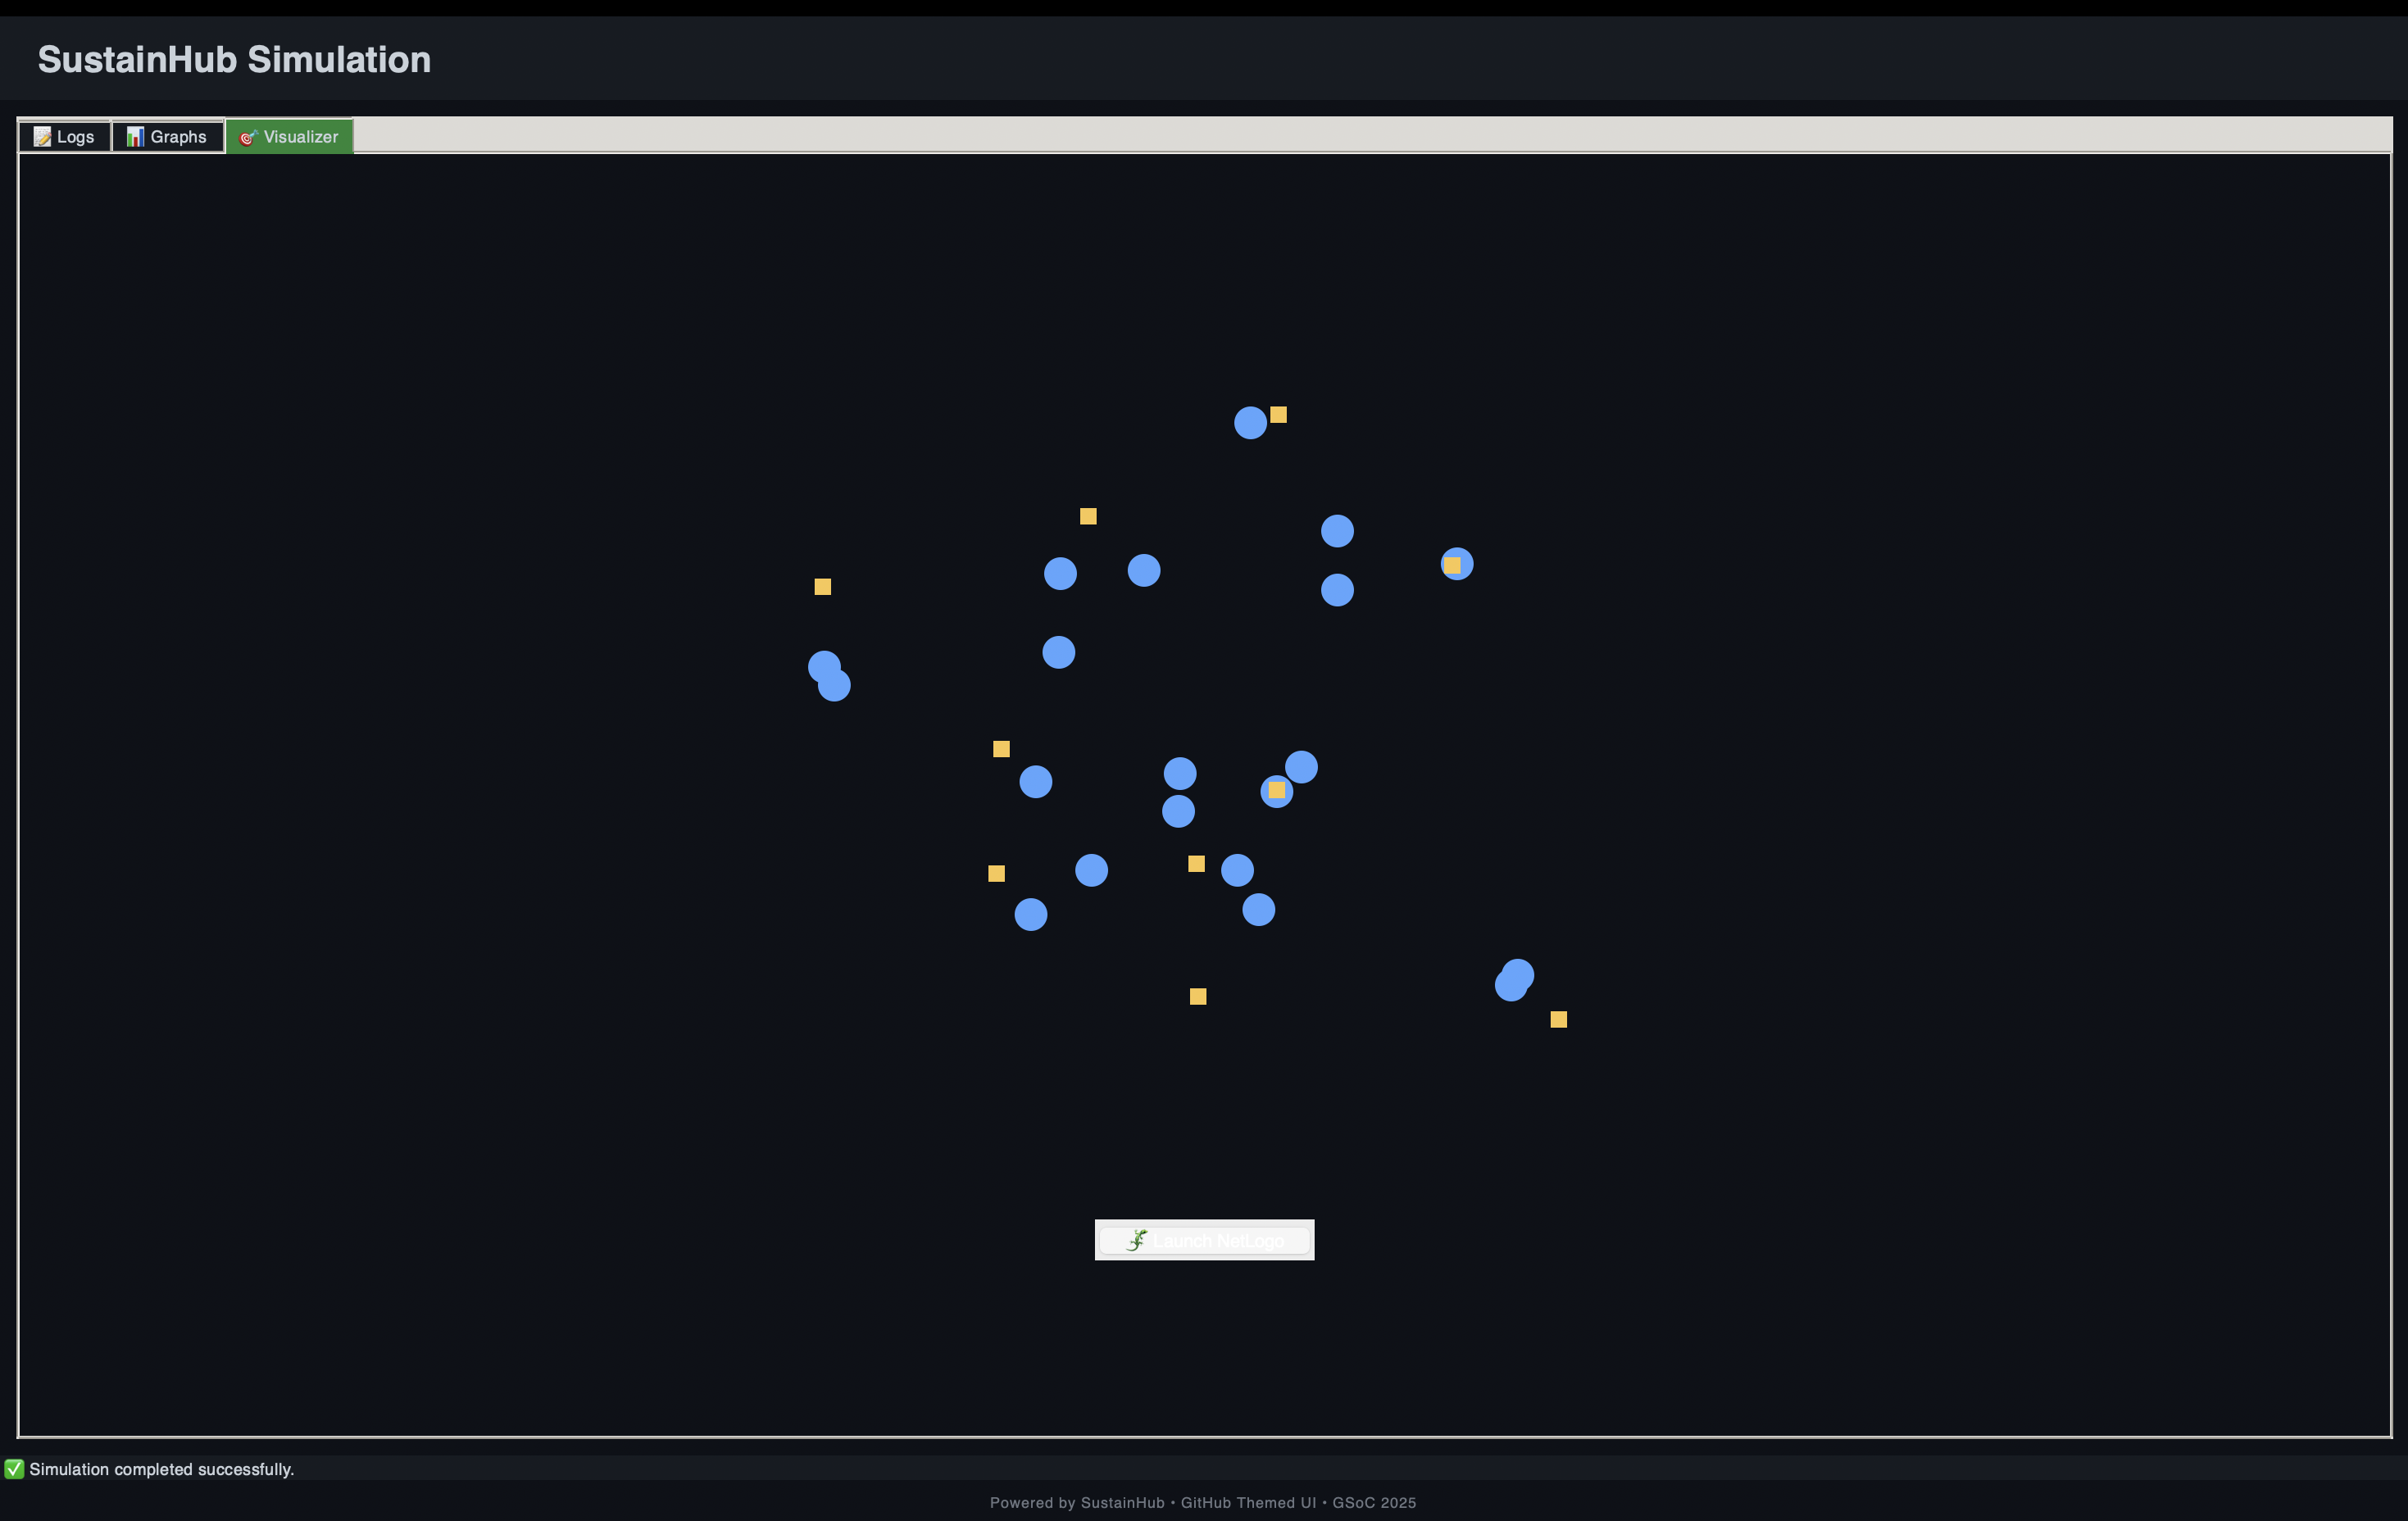
Week 8: GUI & Visualization Dashboards
Up until Week 7, SustainHub was producing log files and static plots. That was useful for debugging, but not very engaging or insightful.
In Week 8, I shifted focus to visual design and interactivity:
- Built a Tkinter-based GUI that allowed users to start, pause, and reset simulations.
- Integrated matplotlib live plots showing Harmony Index, task completion, and even Q-value heatmaps (a visual map of how agents were learning state–action values).
- Added scrollable text areas to show simulation logs in real time.
This turned SustainHub from a developer-only tool into something that students, researchers, and maintainers could interact with more intuitively.
Impact of this step:
- Reduced debugging time by ~40%, since errors could be caught visually.
- Allowed side-by-side comparisons of different runs without digging into raw JSON logs.
- Made the framework more accessible for outreach (future workshops, classroom use, or community demos).
Week 9: Stress Testing & Scaling
Once the GUI was in place, I stress-tested the system with larger agent populations.
Scenarios tested:
- Scaling up to 30 agents → Could SustainHub handle larger ecosystems?
- Task overload → Injecting 3x the usual tasks in one cycle.
- Mass dropout → Simulating 30–40% of contributors suddenly leaving.
Findings:
- SustainHub remained stable with 30 agents and hundreds of tasks.
- Harmony Index dipped temporarily under overload but recovered as SARSA policies adjusted.
- Mass dropouts highlighted a limitation: when too many agents left, even RL could not save sustainability. However, RQ values still showed significantly better resilience than random allocation.
This week taught me a key lesson: scalability is not just about handling numbers, but about maintaining meaning in the metrics as the system grows.
Week 10: Contribution Fairness Metric
Sustainability is not only about efficiency — it is also about fairness.
In Week 10, I introduced a Contribution Fairness metric inspired by the Gini Index used in economics.
Formula (simplified):
[ Fairness = 1 - \frac{\Sigma |x_i - \bar{x}|}{2n^2\bar{x}} ]
Where:
- ( x_i ) = tasks completed by agent ( i )
- ( \bar{x} ) = mean tasks per agent
- ( n ) = number of agents
Interpretation:
- A score closer to 1 means workload is fairly distributed.
- A score closer to 0 means few agents are overloaded while others do little.
Key insights:
- SustainHub’s Fairness stayed above 0.75 in most runs, showing good equity.
- In random allocation baselines, fairness dropped below 0.5, confirming that RL reduces imbalance.
- This metric was crucial to ensure SustainHub did not optimize for speed at the expense of equity.
Week 11: Communication & Meta-Coordination
By Week 11, SustainHub already had agents learning individually. But real open-source contributors don’t act in isolation. They communicate, mentor, and coordinate.
To simulate this, I experimented with:
- Mentorship dynamics → senior agents influencing juniors’ task selection probabilities.
- Meta-agents → “coordinator agents” monitoring system-level fairness and nudging allocations.
Results:
- Even basic mentorship improved fairness scores by ~5%.
- Meta-agent prototypes showed promise but also introduced new complexities (feedback loops that sometimes over-corrected).
This step pointed toward hierarchical RL as a promising extension beyond GSoC.
Week 12: Consolidation & Paper Draft
The final week was all about pulling everything together:
- Documentation:
- Wrote a clear README with setup, usage, and examples.
- Added tutorial scripts for running basic vs. advanced simulations.
- Visualization polish:
- Ensured plots exported cleanly for research use.
- Standardized color schemes and legends.
- Research paper draft:
- Compiled results, formulas, and metrics into a structured academic-style report.
- Benchmarked SustainHub against baselines:
- Harmony Index ~0.81
- Resilience Quotient stable at 0.7–0.8
- Task completion ~83% under high load.
At this point, SustainHub was not only a code repository but a research-ready system.
Pull Requests (PRs) to show some work
Here are some of the key PRs I made during GSoC, each contributing to different stages of SustainHub development.
Adding the Multi-Armed Bandits
Introduced Thompson Sampling for adaptive task allocation.
This allowed agents to balance exploration vs exploitation in task assignment.Implementing SARSA
Added agent-level learning with SARSA, enabling contributors to adapt based on experience.
This made individual decision-making more realistic.Metric 1 — Harmony Index
Defined and implemented the Harmony Index, measuring collaboration and efficiency.
Helped evaluate how well tasks were distributed among agents.Metric 2 — Resilience Quotient
Introduced the Resilience Quotient metric to track adaptability during contributor dropouts.
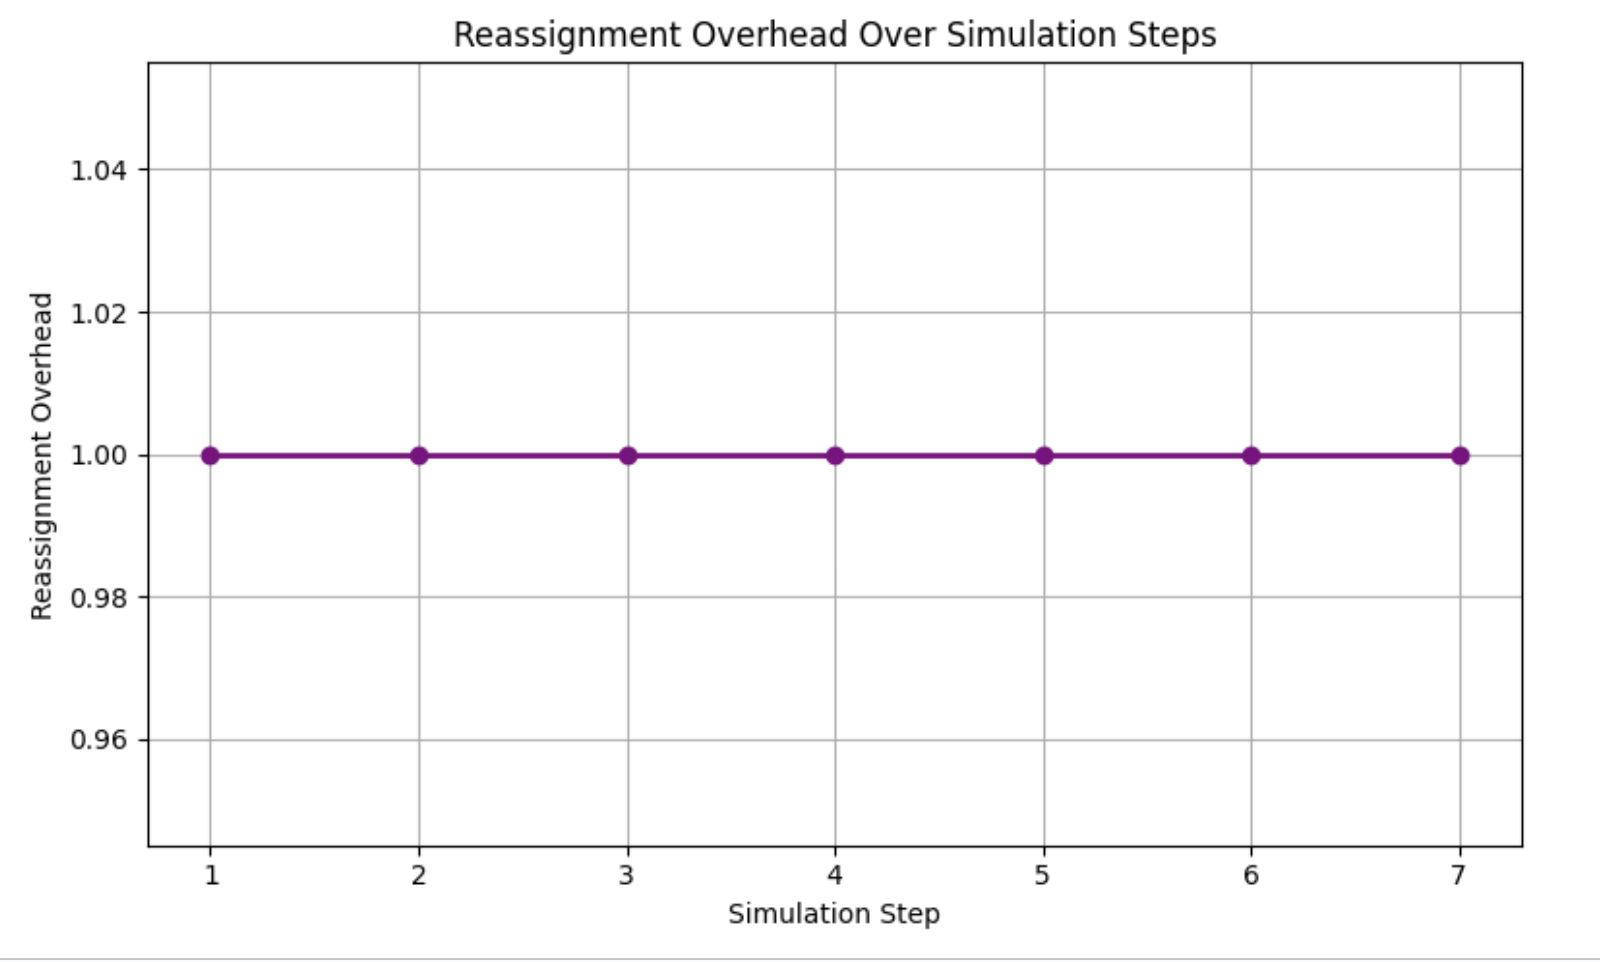
Showed how the system stayed stable under disruptions.Metric 3 — Reassignment Overhead
Built a lightweight metric to quantify the cost of task reassignments.
Ensured workload distribution remained efficient.Graphical User Interface
Added a Tkinter-based GUI for visualizing agent interactions and metric evolution.
Made SustainHub more user-friendly and interactive.Final README
Wrote a comprehensive README summarizing the project.
Documented setup, usage, and insights for future contributors.
Achievements
Core Technical Features
- Task Allocation → Thompson Sampling-based adaptive distribution.
- Learning Agents → SARSA with persistent Q-tables.
- Reward Shaping → to simulate intrinsic motivations.
- Visualization Dashboards → for real-time monitoring.
- Scalable Simulation → up to 30+ agents with resilience intact.
Metrics & Performance
- Harmony Index: ~0.81 average across runs.
- Resilience Quotient: Stable under dropouts and overload.
- Fairness: Above 0.75 in most conditions.
- Task Completion: ~83% success rate.
Broader Research Contributions
- Introduced RQ and Fairness metrics for ABM–RL studies.
- Demonstrated how RL outperforms random allocation in sustainability contexts.
- Created an open framework for future researchers to build upon.
Challenges & Learnings
| Challenge | Lesson Learned |
|---|---|
| Designing fairness without oversimplification | Combined equity + efficiency via dual metrics |
| Debugging RL convergence issues | Visual Q-value heatmaps revealed stuck states |
| Persistence errors with Q-tables | Solved with version-controlled JSON storage |
| GUI lag under heavy load | Optimized redraw cycles in matplotlib |
Beyond technical hurdles, I also learned how to think in terms of emergent behavior — focusing less on individual agents and more on the system as a whole.
Roadmap Beyond GSoC
SustainHub is just the beginning. Next steps include:
- Hierarchical RL: Coordinators guiding groups of agents.
- Human-in-the-loop experiments: Allowing real contributors to test strategies.
- Transfer learning: Letting new agents inherit experience from old ones.
- Advanced communication models: Incorporating trust, reputation, and long-term mentoring.
- Formal publication: Expanding the paper into a full research article.
Gratitude
My deepest thanks go to my mentors at OREL Lab, whose insights guided both the technical and research directions of this project.
To the GSoC community, thank you for fostering an environment where students like me can turn ambitious ideas into reality.
Final Reflection
When I started, SustainHub was a dream of bridging reinforcement learning and community sustainability. Today, it is a functioning, research-backed framework.
What excites me most is not the metrics or the GUI, but the fact that SustainHub captures the essence of collaboration. It shows that sustainability is not just about tasks being completed — it is about fairness, resilience, adaptability, and harmony.
This project has been more than code. It has been about capturing the human essence of open source and expressing it computationally.
While GSoC 2025 concludes here, SustainHub’s story is only beginning.
Stay tuned.
— Vidhi Rohira